Monitoring the Status of the Cluster
Scyld ClusterWare provides several methods to monitor cluster performance and health,
with a Web browser, a GUI, the command line, and “C” language
interfaces. In general, these tools provide easy access to the
information available through the Linux /proc filesystem, as well as
BProc information for each of the cluster nodes. The monitoring programs
are available to both administrators and regular users, since they
provide no cluster command capabilities.
Monitoring Utilities
Cluster Monitoring Interfaces
Scyld ClusterWare provides several cluster monitoring interfaces. Following is brief summary of these interfaces; more detailed information is provided in the sections that follow:
libbeostat— Thelibbeostatlibrary, together with the compute nodes’sendstatsdaemons and the master node’srecvstatsdaemon, provides the underpinning for the various display tools. Users can also create custom displays or create more sophisticated resource scheduling software by interfacing directly to libbeostat.beostat— Thebeostatcommand provides a detailed command-line display using the underlying libbeostat library. With no options,beostatlists information for the master node and all compute nodes that is retrieved from/proc/cpuinfo,/proc/meminfo,/proc/loadavg,/proc/net/dev, and/proc/stat. Alternatively, you can use the arguments to select any combination of those statistics.beostatus— Thebeostatuscluster monitoring utility uses the underlying libbeostat functionality to display CPU utilization, memory usage, swap usage, disk usage, and network utilization. It defaults to a bar graph X-window GUI, but can display the information in several text formats. For large clusters, a small footprint GUI can be selected, with colored dots depicting the overall status on each node.bpstat— This displays a text-only snapshot of the current cluster state. The bpstat utility only reports nodes that are part of the BProc unified process space, vs. beostat and beostatus, which report on all nodes (BProc and non-BProc) that execute a sendstats daemon.Ganglia— Scyld installs the popularGangliamonitoring package by default, but does not configure it to execute by default. For information on configuring Ganglia, see Ganglia.beoweb—Beowebis an optional Web service that can execute on the cluster’s master node. Built withPylons(a Python-based Web framework), beoweb exposes an API for cluster status and remote job submission and monitoring.
Monitoring Daemons
Underlying the libbeostat monitoring facility are two daemons:
sendstats and recvstats. The recvstats daemon is started by
the /etc/rc.d/init.d/clusterware script and only executes on the
master node. A sendstats daemon executes on each compute node and
sends status information at regular intervals (currently once per
second) to the master’s recvstats daemon. For more information on
the daemon options, see man recvstats and man sendstats, or the
Reference Guide.
The optional beoweb service employs the paster daemon on the
master node. See beoweb for details.
Using the Data
The outputs from the monitoring utilities can provide insights into obtaining the best performance from your cluster. If you are new to cluster computing, you will want to note the relationship between the different machine resources, including CPU utilization, swap usage, and network utilization. Following are some useful guidelines:
Low CPU usage with high network traffic might indicate that your system is I/O bound and could benefit from faster network components.
Low network load and high CPU usage indicate that your system performance could improve with faster CPUs.
Medium to high swap usage is always bad. This indicates that memory is oversubscribed, and application pieces must be moved to the much slower disk sub-system. This can be a substantial bottleneck, and is a sure sign that additional RAM is needed.
Any of these issues could be helped with application optimization, but sometimes it is more economical to add resources than to change working software.
For best performance of a computational workload, make sure your compute nodes have ample memory for the application and problem set. Also, use diskless compute nodes or configure local disks for scratch file space rather than swap space.
beostatus
The beostatus GUI display is a Gnome X-window that supports four
different types of display generation, all of which can be operated
simultaneously. Output in bar graph mode (also known as “Classic” mode)
is the default, and is provided by a Gnome/GTK+ GUI display. This
display is updated once every 5 seconds by default, but the update rate
may be changed using the -u option.
You can start beostatus by clicking the “blocks” icon on the
desktop.
![]()
Alternatively, type the command beostatus in a terminal window on
the master node; you do not need to be a privileged user to use this
command.
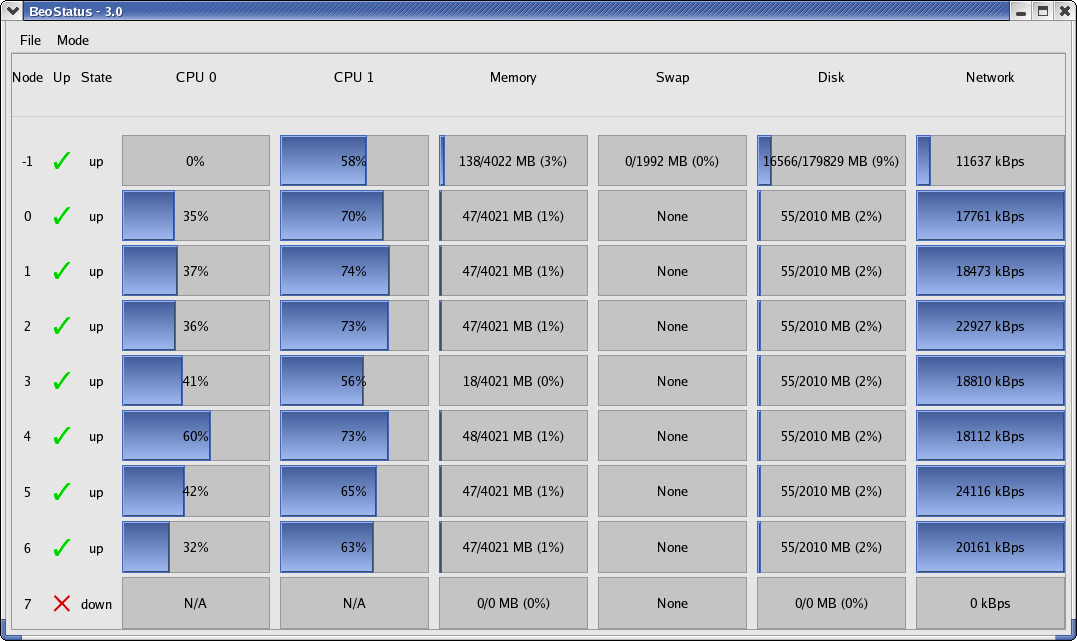
Figure 1. beostatus GUI Display (in “Classic” Mode)
beostatus File Menu
The File menu in the beostatus GUI display includes two options,
Preferences and Quit, as described below.
Preferences
Selecting Preferences from the File menu displays the Options dialog box (shown below). You can change the values for update rate, master node maximum bandwidth, slave (compute node) maximum bandwidth, and the default display mode.
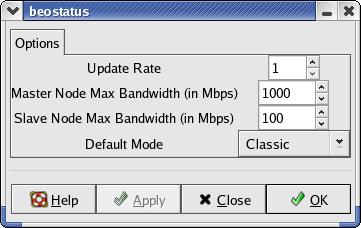
Figure 2. beostatus Preference Options
Quit
Selecting Quit from the File menu closes the beostatus GUI display.
beostatus Modes
The Mode menu in the beostatus GUI display allows you to choose
between the various display options.
Some display options can also be accessed using command line options, including Dots mode, Curses mode, and Text mode. These display options are described in the following sections.
beostatus Dots Mode
Output in Dots mode (beostatus -d) provides a Gnome/GTK+ GUI
display. Each node is represented by a colored dot. This output provides
a small “footprint”, intended for quick overviews and for situations
where the screen size needed for the full display for large clusters is
unavailable.

Figure 3. beostatus GUI Display in Dots Mode
Following are the color indicators used in Dots mode:
Red— No access; node statedownYellow— Admin access only; node state unavailable, boot, or errorGreen— Ready; node state up and node load less than/equal 48%Blue— Busy; node state up and node load greater than 48%
Note that SMP is considered for node load calculation as load(CPU1) + load(CPU2) > 48%.
beostatus Curses Mode
Output in Curses mode (beostatus -c) prints a column header and a
line for each node without a linefeed. This continuous output provides a
method to monitor the system over text-only connections, such as the
installed ssh server. Following is an example of the output in
Curses mode:
BeoStatus - 3.0
Node    State   CPU 0   Memory  Swap    Disk    Network
 -1 up  2.5%    91.7%   0.0%    9.2%    1 kBps
  0 up  0.2%    20.5%   0.0%    25.0%   1 kBps
  1 up  0.1%    20.5%   0.0%    25.0%   1 kBps
  2 up  0.1%    20.5%   0.0%    25.0%   1 kBps
  3 up  0.2%    20.4%   0.0%    25.0%   1 kBps
  4 up  0.1%    20.3%   0.0%    25.0%   1 kBps
  5 up  0.1%    20.3%   0.0%    25.0%   1 kBps
  6 up  0.2%    20.6%   0.0%    25.0%   1 kBps
  7 up  0.1%    20.4%   0.0%    25.0%   1 kBps
beostat
The beostat utility is a command-line program that provides a text
listing of the information from /proc on each node. Following is
example output from a single node.
============== Node: .0 (index 0) ==================

 *** /proc/cpuinfo *** Tue Sep 12 14:38:04 2006
num processors  : 2
vendor_id       : AuthenticAMD
cpu family      : 15
model           : 5
model name      : AMD Opteron(tm) Processor 248
stepping        : 10
cpu MHz         : 2211.355
cache size      : 1024 KB
fdiv_bug        : no
hlt_bug         : no
sep_bug         : no
f00f_bug        : no
coma_bug        : no
fpu             : yes
fpu_exception   : yes
cpuid level     : 1
wp              : yes
bogomips        : 4422.05

 *** /proc/meminfo *** Tue Sep 12 14:38:04 2006
        total:    used:    free:  shared: buffers:  cached:
Mem:  4216758272 18960384 4197797888        0        0        0
Swap:        0        0        0
MemTotal:   4117928 kB
MemFree:    4099412 kB
MemShared:        0 kB
Buffers:          0 kB
Cached:           0 kB
SwapTotal:        0 kB
SwapFree:         0 kB

 *** /proc/loadavg *** Tue Sep 12 14:38:04 2006
0.00 0.00 0.00 28/28 0

 *** /proc/net/dev *** Tue Sep 12 14:38:04 2006
Inter-|   Receive                                                |  Transmit
 face |bytes packets errs drop fifo frame compressed multicast | bytes packets errs drop fifo colls carrier compressed
  eth0:105630479    73832        0        0        0     0          0         0  5618030  35864        0        0        0     0       0          0
  eth1:       0        0        0        0        0     0          0         0        0     0        0        0        0     0       0          0

 *** /proc/stat ***
cpu0 0 0 115 203357             Tue Sep 12 14:38:04 2006
cpu1 4 0 125 203261             Tue Sep 12 14:38:04 2006

 *** statfs ("/") *** Tue Sep 12 14:38:04 2006
path:           /
f_type:         0x1021994
f_bsize:        4096
f_blocks:       514741
f_bfree:        500311
f_bavail:       500311
f_files:        514741
f_ffree:        514630
f_fsid:         000000 000000
f_namelen:      255
The libbeostat library contains the “C” language functions listed
below. You compile with the header files sys/bproc.h and
sys/beostat.h, adding the linker commands -lbproc -lbeostat.
beostat-get-cpu-count
beostat-get-name
beostat-get-time
beostat-get-cpuinfo-x86
beostat-get-meminfo
beostat-get-loadavg
beostat-get-net-dev
beostat-get-stat-cpu
beostat-get-MHz
beostat-get-statfs-p
beostat-get-last-multicast
beostat-set-last-multicast
beostat-get-cpu-percent
beostat-get-net-rate
beostat-get-disk-usage
beostat-count-idle-cpus
beostat-count-idle-cpus-on-node
beostat-get-avail-nodes-by-id
beostat-is-node-available
bpstat
bpstat displays a text-only snapshot of the current cluster
state/configuration:
[root@cluster ~] # bpstat
Node(s) Status  Mode        User    Group
16-31   down    ----------  root    root
0-15    up  ---x--x--x  root    root
You can include the master node in the display, which is especially useful if the master node has non-default access permissions:
[root@cluster ~] # bpstat
Node(s) Status  Mode        User    Group
16-31   down    ----------  root    root
-1  up  ---x--x---  root    root
0-15    up  ---x--x--x  root    root
Using the -p option, you can view the PID for each user process
running on the nodes. You can then pipe the ps command into grep
to get the command string associated with it, such as
ps -aux |grep 8370. Normal process signaling will work with these
PIDs, such as kill -9 8369.
PID Node    Ghost
8367    0   -1
8368    1   -1
8369    2   -1
8370    3   -1
See the Reference Guide for more details on the command options.
Ganglia
Ganglia is an open source distributed monitoring technology for
high-performance computing systems, such as clusters and grids. In
current versions of Scyld ClusterWare, Ganglia provides network metrics for the
master node, time and string metrics (boottime, machine_type,
os_release, and sys_clock), and constant metrics (cpu_num
and mem_total). Ganglia uses a web server to display these
statistics; thus, to use Ganglia, you must run a web server on the
cluster’s master node.
When installing Scyld ClusterWare, make sure the Ganglia package is selected among
the package groups to be installed. Once you have completed the Scyld
installation and configured your compute nodes, you will need to
configure Ganglia as follows:
Name your cluster.
By default,
Gangliawill name your cluster “my cluster”. You should change this to match the master node’s hostname. In the file/etc/gmetad.conf, and on or about line 39, change:data_source "my cluster" localhost
to replace my cluster with the master’s hostname. Note that
Gangliawill not collect or display statistics without at least one entry fordata_source.Enable and start the Ganglia Data Collection Service.
[root@cluster ~] # chkconfig beostat on
[root@cluster ~] # systemctl enable  xinetd
[root@cluster ~] # systemctl enable  httpd
[root@cluster ~] # systemctl enable  gmetad
[root@cluster ~] # systemctl restart xinetd
[root@cluster ~] # systemctl start   httpd
[root@cluster ~] # systemctl start   gmetad
Visit
http://localhost/gangliain a web browser.
Note that if you are visiting the web page from a computer other than
the cluster’s master node, then you must change localhost to the
master node’s hostname. For example, if the hostname is “iceberg”, then
you may need to use its fully qualified name, such as
http://iceberg.penguincomputing.com/ganglia.
Caution
The
Gangliagraphs that track load (1-, 5-, and 15-minute), the number of CPUs, and the number of processes may appear inaccurate. These graphs are in fact reporting correct statistics, but for the system as a whole rather than just user processes. Scyld draws its statistics directly from system data structures and/proc. It does not take any further steps to interpret or post-process the metrics reported by these data structures.
beoweb
The beoweb service does not execute by default. To enable it:
chkconfig beoweb on
and then it will start automatically the next time the master node boots. It can be started immediately by doing:
[root@cluster ~] # service beoweb start
Beoweb exposes an API for cluster status monitoring and remote job
submission and monitoring. In its current state, beoweb is best used
when paired with PODTools to enable remote job submission. (See the
User’s Guide for details about PODTools.) Beoweb does not yet support
being viewed with a web browser; rather, it merely provides a web
service accessible through APIs. Beoweb supports job submission using
the TORQUE resource manager or SGE.
Beoweb is installed in /opt/scyld/beoweb, and the main configuration
file, beoweb.ini, is located there. Some key settings to inspect
are:
host = 0.0.0.0This specifies the interface on which Beoweb will bind/listen. 0.0.0.0 specifies all available interfaces. Use an actual IP address to limit this to a single interface.
port = 5000The port number on which beoweb listens. Change to a different port number as needed.
ssl_pem = %(here)s/data/beoweb.pemThe ssl_pem parameter controls whether or not beoweb uses SSL/TLS encryption for communication. It is strongly encouraged that you use SSL. When beoweb is installed, a temporary PEM file will be created at %(here)s/data/beoweb.pem. This certificate is good for 365 days.
auth.use_system_shadow = TrueThe value defaults to True. Unless explicitly disabled, beoweb will read
/etc/shadowfor user authentication. If this is set to False, you must useauth.auth_fileto specify a different list of authorized users.auth.auth_file = %(here)s/data/shadowThis file allows for user passwords to be stored independently from the master node’s
/etc/shadowfile. Currently, beoweb only supports shadow-type login accounts. For example, if you put user credentials in%(here)s/data/shadowand not in/etc/shadow, then that user can access the master node’s beoweb services without being allowed to actually login to the master node. The format for this file is identical to/etc/shadow.stage.jobs_dir = podsh_jobsThis names a folder that will be created and used in a user’s home directory for job scripts uploaded through PODTools.
stage.port_range = 10000-11000When file uploads and downloads are requested through beoweb using PODTools, the files are transferred through a TCP socket connection. Beoweb opens a socket on the port in the range given in this entry, then sends that port number back to PODTools for use. This range should be chosen such that it does not conflict with other services on your system.