Grafana Login
The ClusterWare Monitoring Graphical Interface employs the Open Source Grafana, InfluxDB, and Telegraf to collect data from compute nodes and head nodes and present the data visually to authorized users. The basic initialization directs InfluxDB to retain data for one week. The retention period can be modified:
TELEGRAF_BUCKET_ID=$(sudo influx bucket list | grep telegraf | awk '{print $1}')
sudo influx bucket update --id ${TELEGRAF_BUCKET_ID} --retention <new-period>
where <new-period> is an integer concatenated with a one-letter abbreviation of a time period, e.g., "7d" or "1w" for one week, "14w" for 14 weeks, "12h" for 12 hours, "1y" for one year. The longer the retention period means the greater the size of retained data. See https://docs.influxdata.com/influxdb/v2.6/reference/internals/data-retention/ for details.
Access the Monitoring GUI through the ClusterWare GUI's "Monitoring" tab (see Introduction) or directly using http://<HEADNODE_IP>/grafana.
Note
The URL http://<HEADNODE_IP>/grafana may differ if the cluster administrator has switched to HTTPS or otherwise modified the Apache configuration.
When the home page is loaded for the first time,
login with username "admin" and the database.admin_pass from the base.ini
(sudo grep pass /opt/scyld/clusterware/conf/base.ini).
After that, you can change the user name and/or the password as you wish by
clicking on the colored icon in the lower left above the "?" question mark to
expose a menu allowing you to view or change "Preferences", "Change Password",
or "Sign out".
Typically after the initial "admin" database.admin_pass login the user should first edit the Preferences to change the user's Name, Email address, and the Username to use for subsequent logins. Then click on "Change Password" and change the password you wish to use for those subsequent logins.
A basic Grafana Monitoring capability is installed preconfigured in ClusterWare. You can further modify this configuration to suit your local cluster needs. New dashboards can be created, or new display panels added to the existing ones to show more customized information. Grafana includes a suite of visualization tools like scatter, line, bar, and pie charts, as well as tables, gauges, and histograms. Since the underlying ClusterWare monitoring database is InfluxDB, any valid Flux-language query can be used to filter or process the data. For more information on InfluxDB and Grafana customization, including links to tutorials, see InfluxDB Notes and Grafana Notes.
To facilitate monitoring of compute node GPU activity,
first install into the GPU compute node image(s)
the NVidia System Management Interface utility (nvidia-smi),
which ships with NVidia GPU drivers.
See https://developer.nvidia.com/nvidia-system-management-interface
for details of that utility, and see
https://www.cyberciti.biz/faq/how-to-install-nvidia-driver-on-centos-7-linux/
for a description of how to install NVidia drivers.
Then in the compute node image(s) copy
/etc/telegraf/telegraf.d/nvidia-smi.conf.example
(distributed in the clusterware-node RPM) to
/etc/telegraf/telegraf.d/nvidia-smi.conf.
Grafana Cluster Monitoring
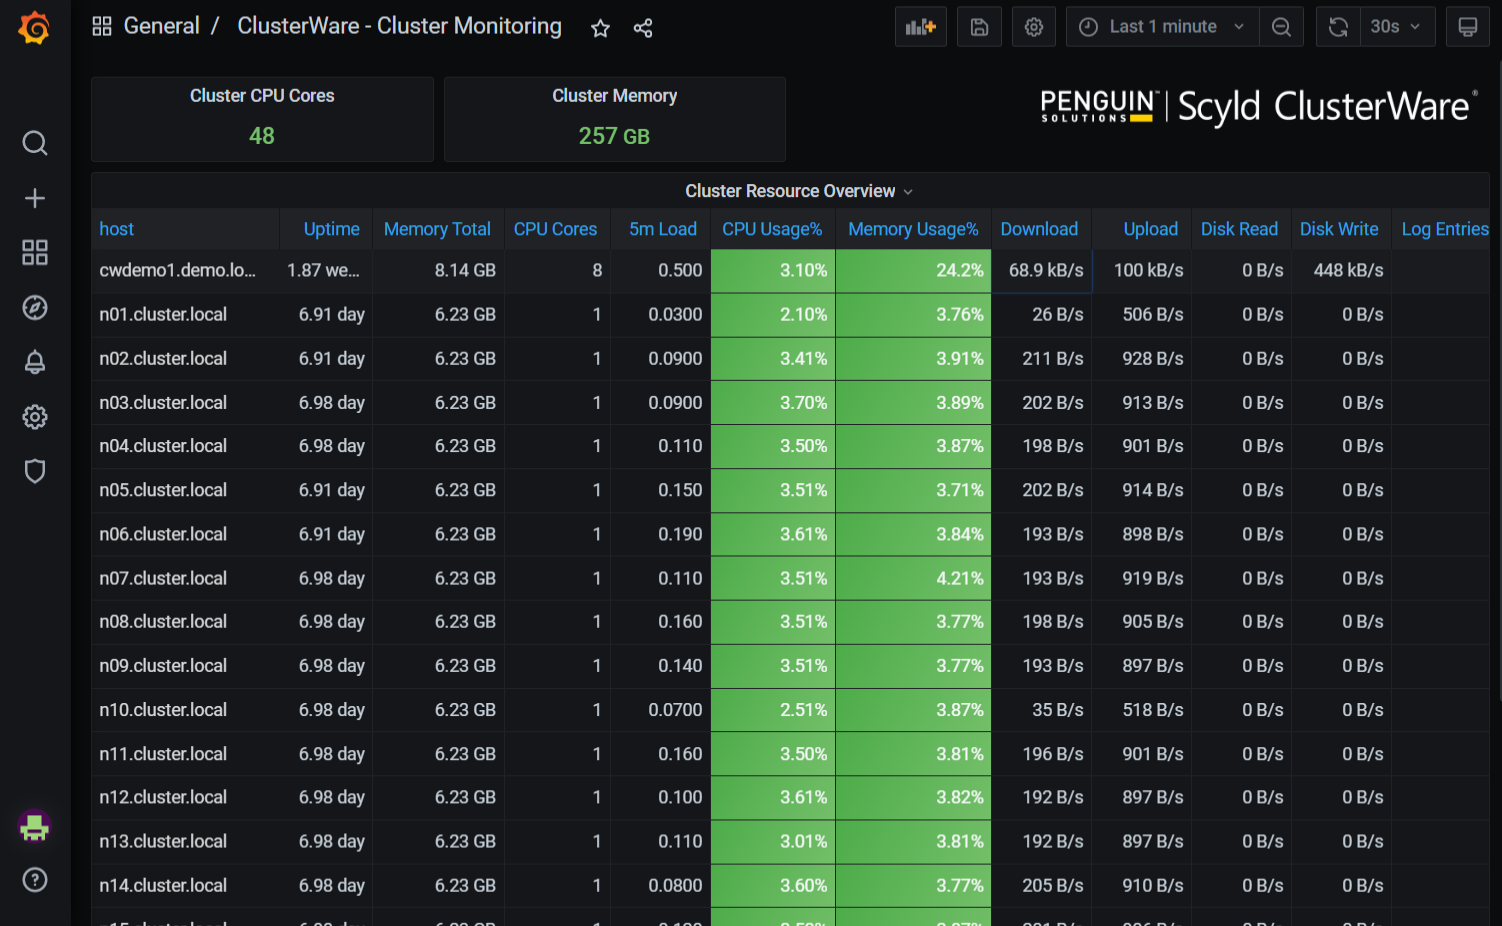
The initial dashboard is ClusterWare - Cluster Monitoring which displays a summary of current activity on the head node and all compute nodes.
Below is an example of the initial screen showing the head node and first 14 nodes of a 40-node cluster. The remaining nodes can be viewed using the scrollbar on the right side of the window.
Grafana General Page
Click on the General / ClusterWare - Cluster Monitoring at the top of the page to display the available dashboards:
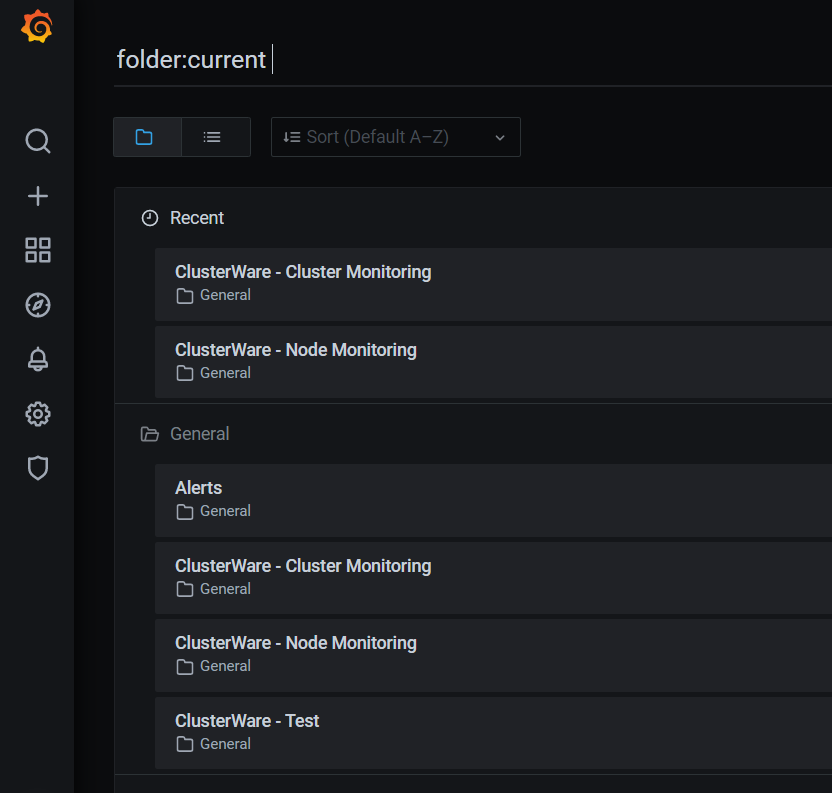
Here you see the "Recent" dashboards and below that the full "General" list. Click on ClusterWare - Node Monitoring to select that dashboard which displays detailed state and activity for individual nodes.
Grafana Node Monitoring
The default Node Monitoring display shows details for individual nodes, beginning with the head node, as seen near the top of the window immediately to the right of "host". As with the General / ClusterWare - Cluster Monitoring display, you can use the right-side scrollbar to see all the available information.
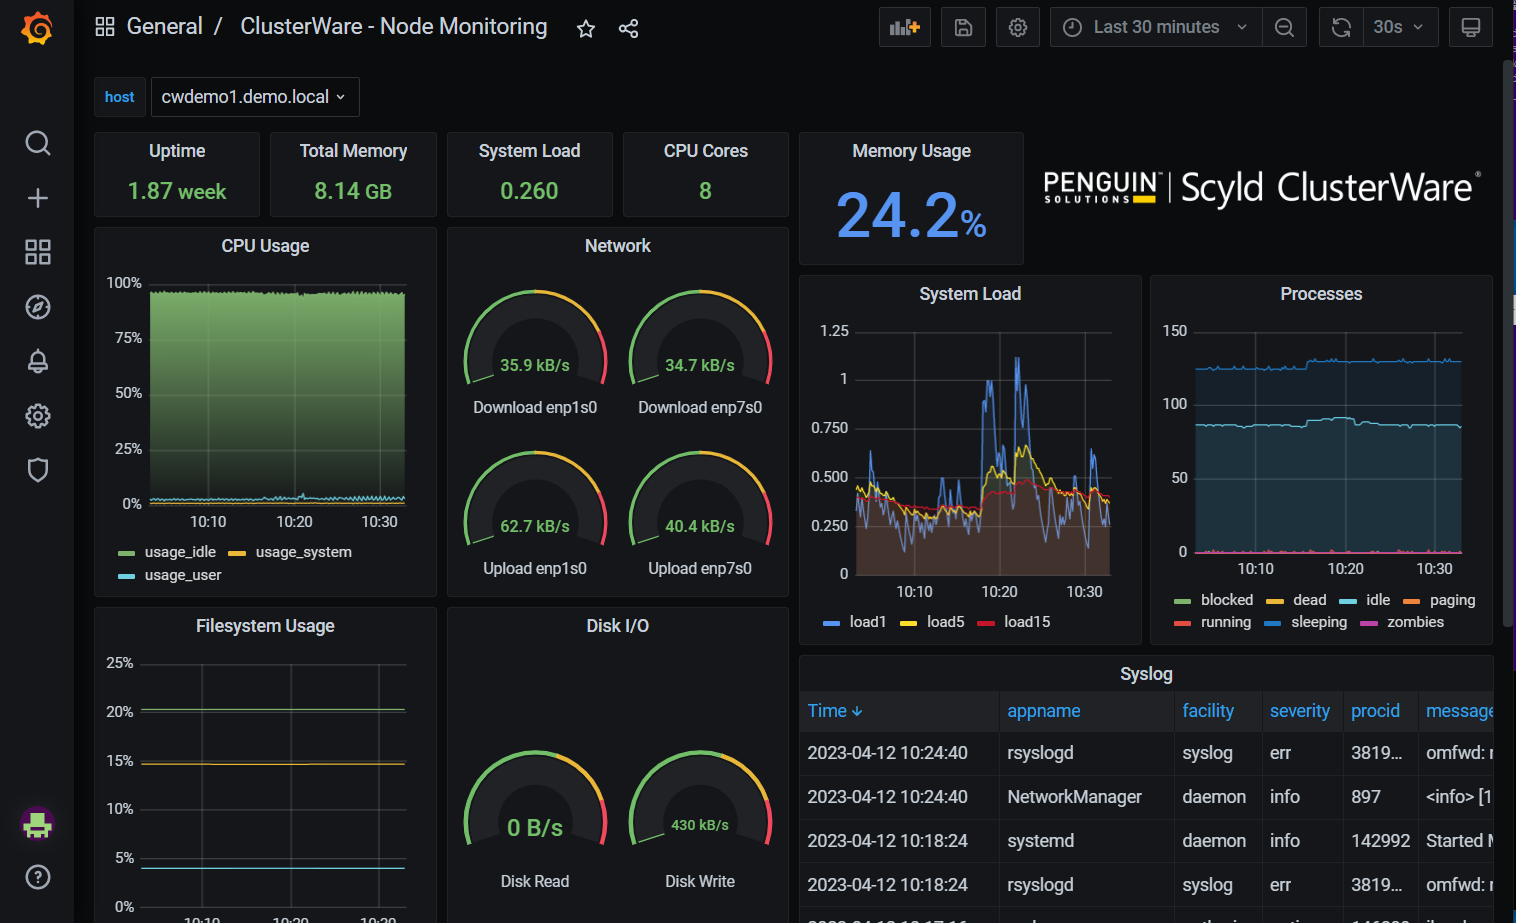
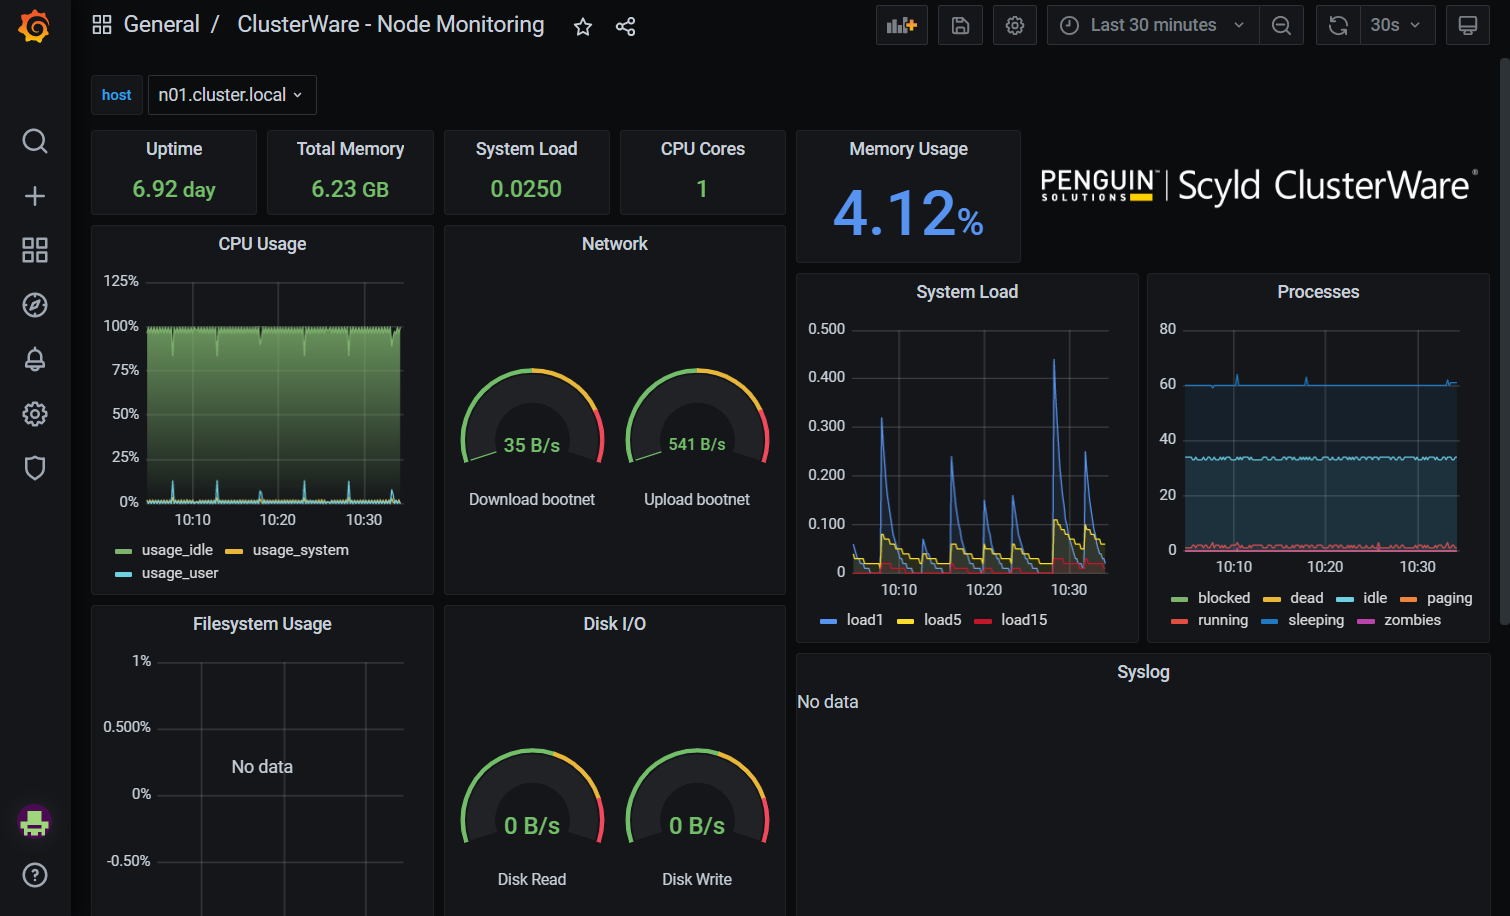
Click on the "host" current node name to expose a pulldown list of the available choices.
For example, select "n01.cluster.local":
Grafana Alerts
The user can define an Alerts dashboard that displays configurable panels that display various activity and the user-defined conditions which will trigger an alert notification. First you must click on the bell icon at the left side of the Grafana window. That opens a window where you can specify Alert Rules, which define the conditions or events about which you want to receive alerts, and Notification channels, which specify how those alerts should be delivered to you. Consult the GrafanaLabs documentation referenced above for details.
An example Alerts dashboard is:
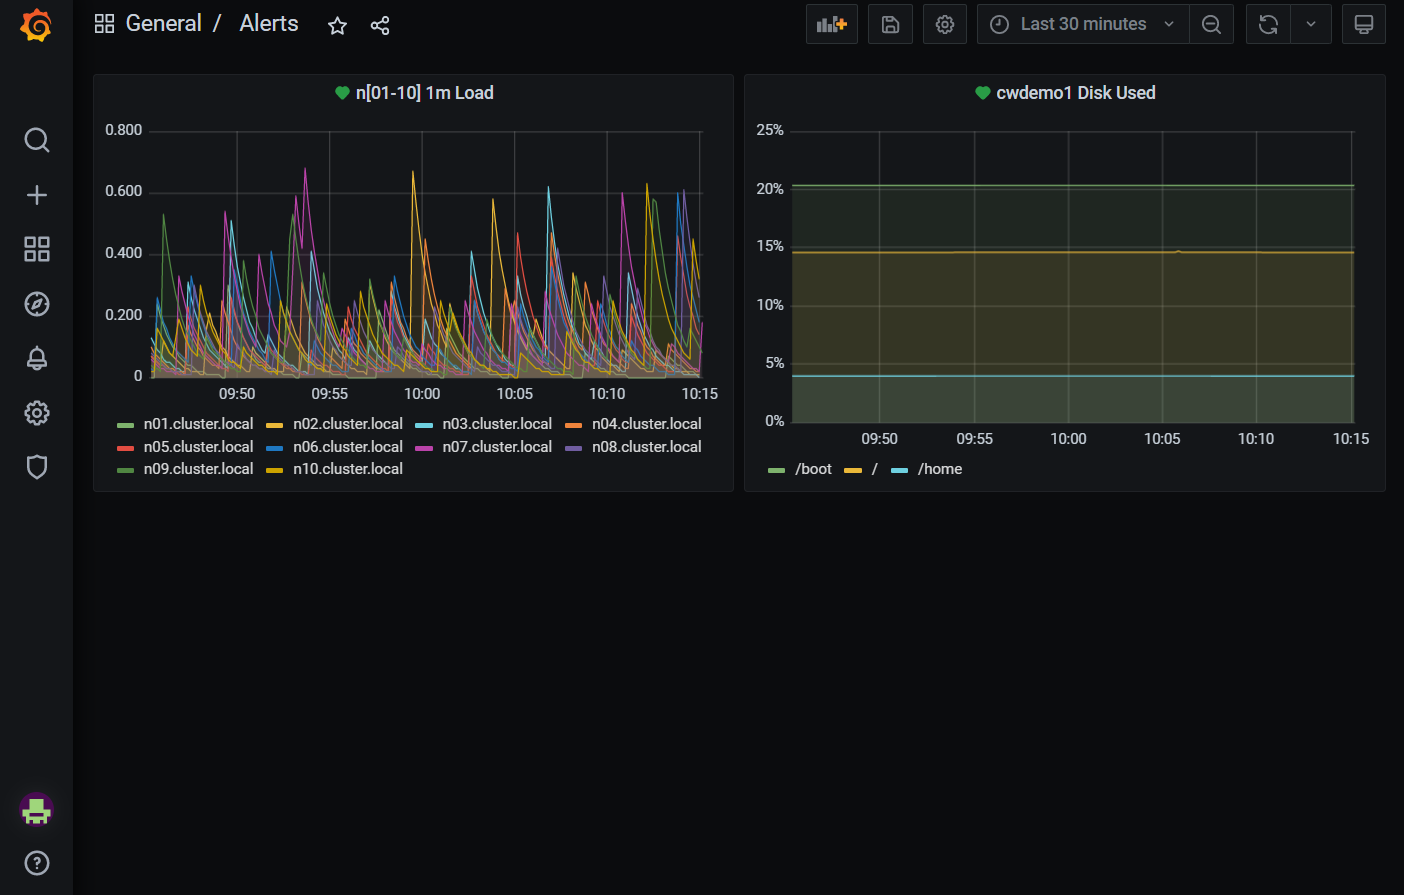
The first panel displays the CPU load levels for the first 10 compute nodes. The second panel displays the disk usage for one head node.
Alerts can be edited by clicking on the title bar to expose a pulldown menu, and in that menu select "Edit". In the example below, you can see the currently defined "Query" that displays what gets shown in the panel, and to the right of "Query" is "Alert" which defines what values will trigger
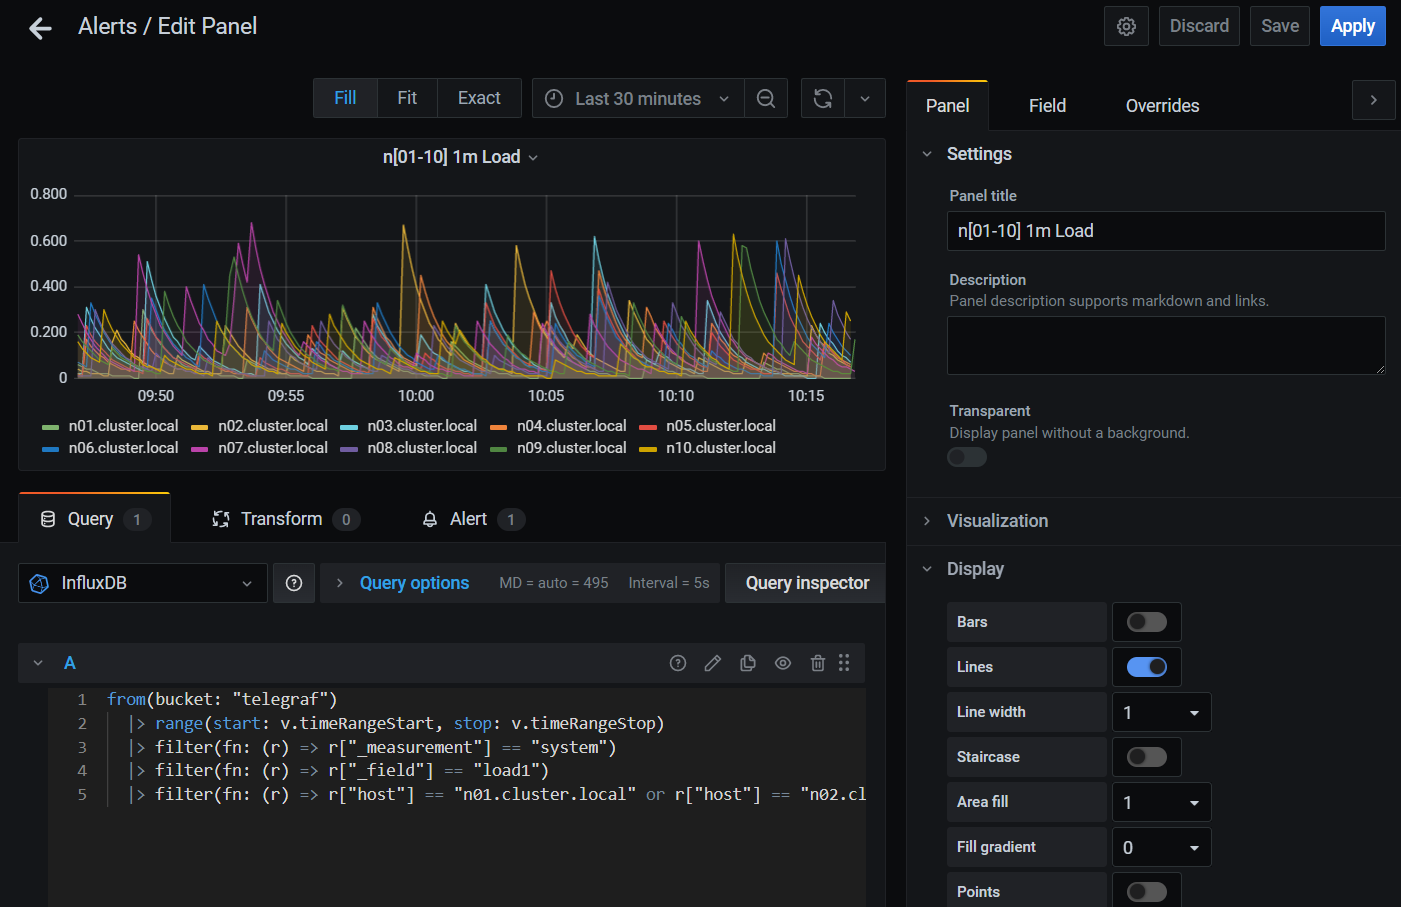
See the GrafanaLabs documentation (URLs shown in Grafana Login) for details about setting up alerts. an alert, what to send in an alert message, and where to send the message.