Graphical Interface
ClusterWare provides a graphical interface (GUI) for administrators to monitor and manage the cluster, Both the GUI and the command-line interfaces (detailed in Reference Guide) employ the same underlying interface to the ClusterWare database.
To use the GUI, point your browser at a head node (or at any node on which
the clusterware-tools package has been installed),
e.g., http://localhost if running on a head node,
or http://cwheadnode2 to access another head node named cwheadnode2.
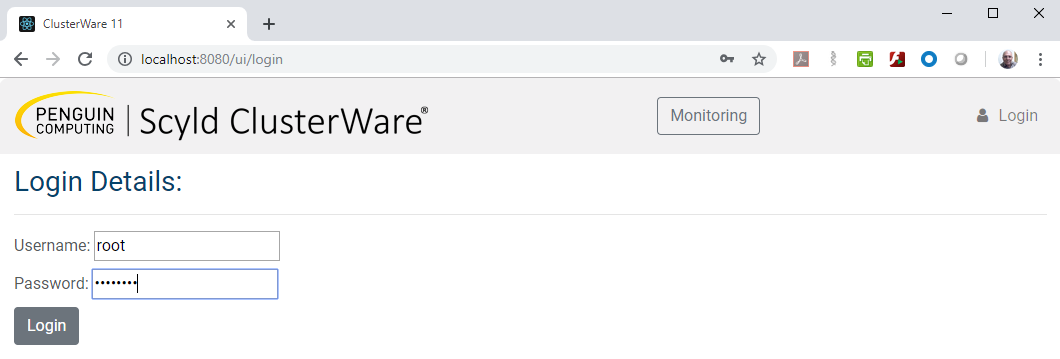
You first see a login screen.
If no cluster administrators have yet been declared
(see the scyld-adminctl command), then login as root:
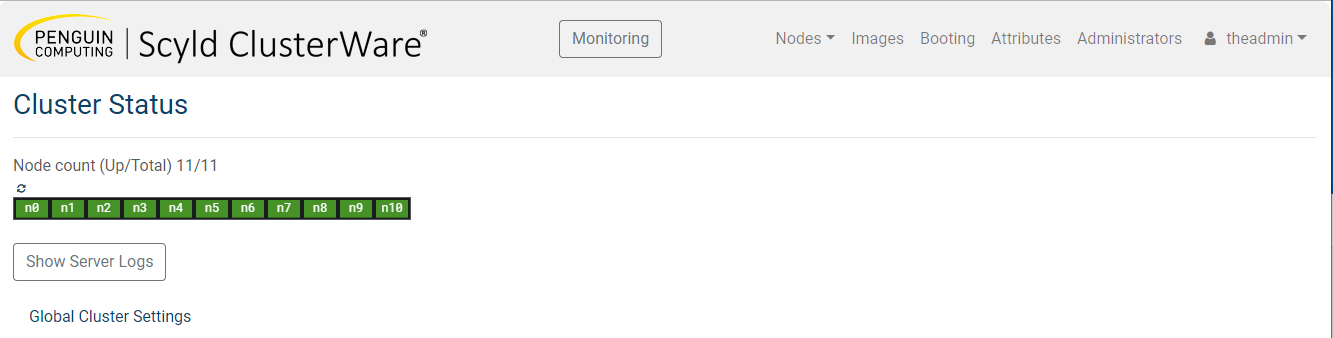
A successful login gets you to the home screen with its summary information. Note the top-level buttons across the top of the window, e.g., Monitoring, Nodes, Booting, etc., that presents additional information and features. You can always return to the home screen by clicking on the Penguin Computing Scyld ClusterWare logo in the top left of any GUI window.
The Monitoring button launches a Chronograf window. See Monitoring the Status of the Cluster for details.
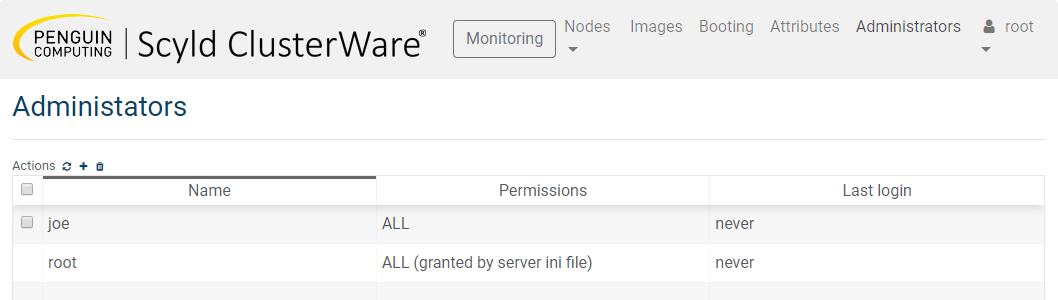
To add more administrators, click on Administrators and see the currently declared user names:
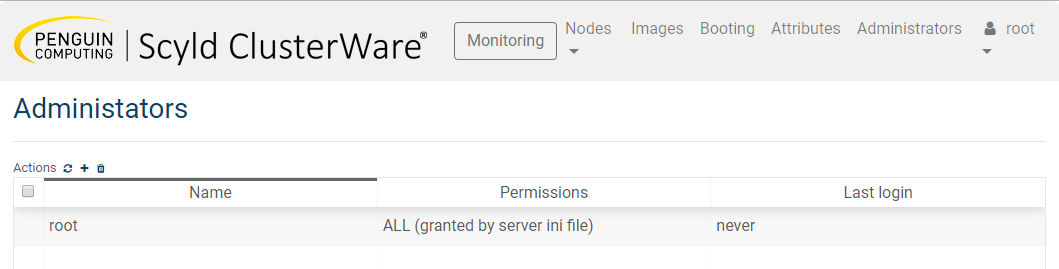
After adding administrator joe:
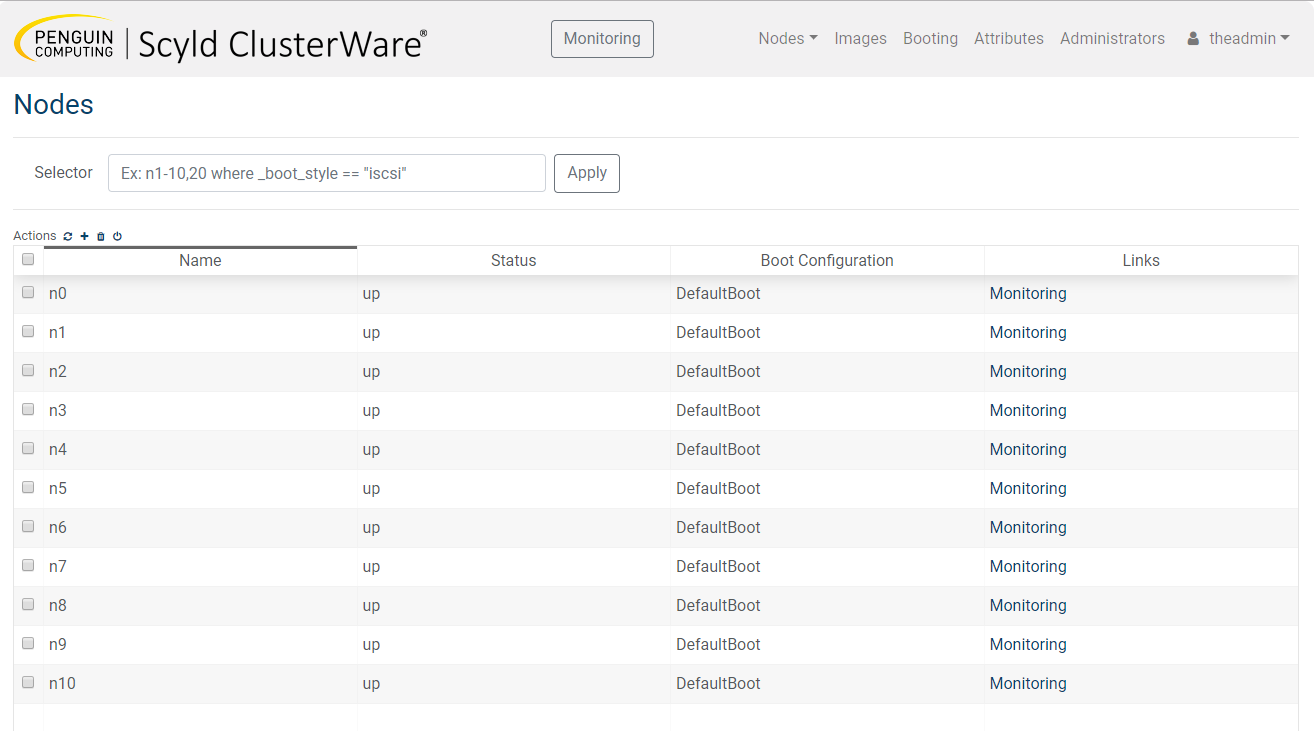
Click on the top-level Nodes pulldown menu to expose two choices. The first choice Node List displays all known nodes and their summary state. You can enter various qualifiers in the Selector text box to narrow down the list of nodes.
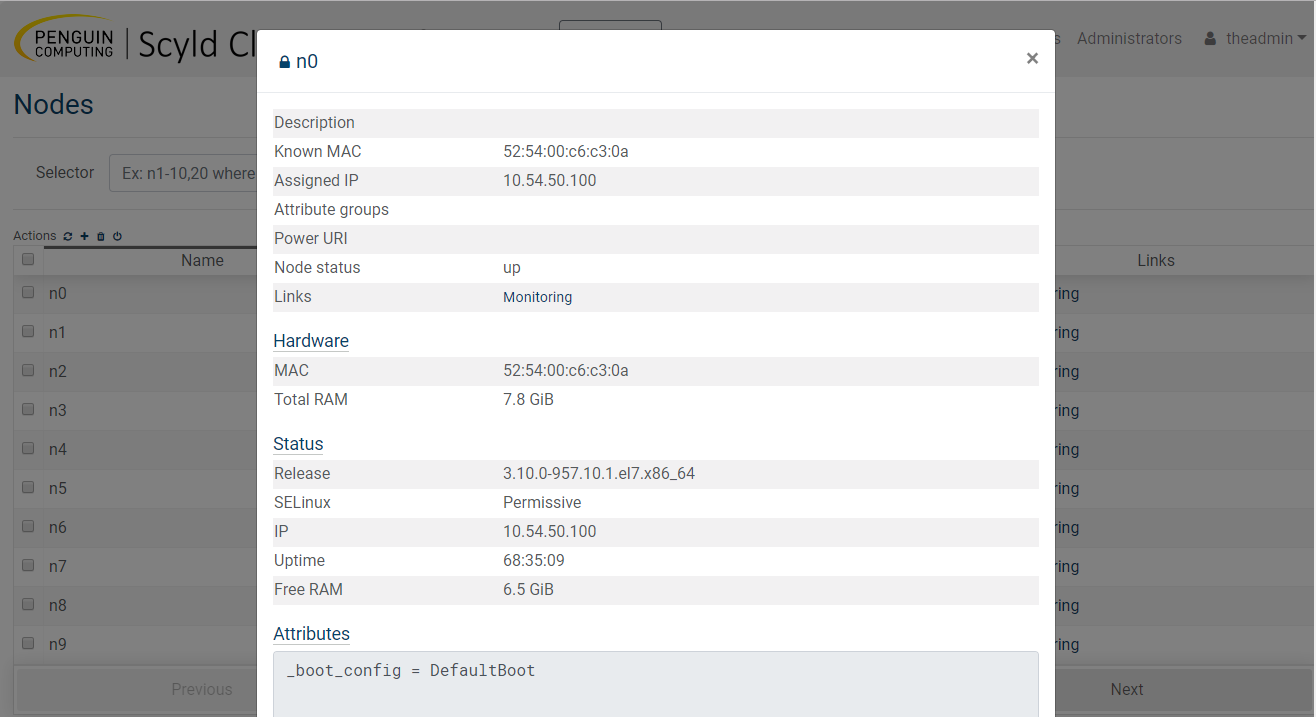
Click on a specific node to see greater detail about that node:
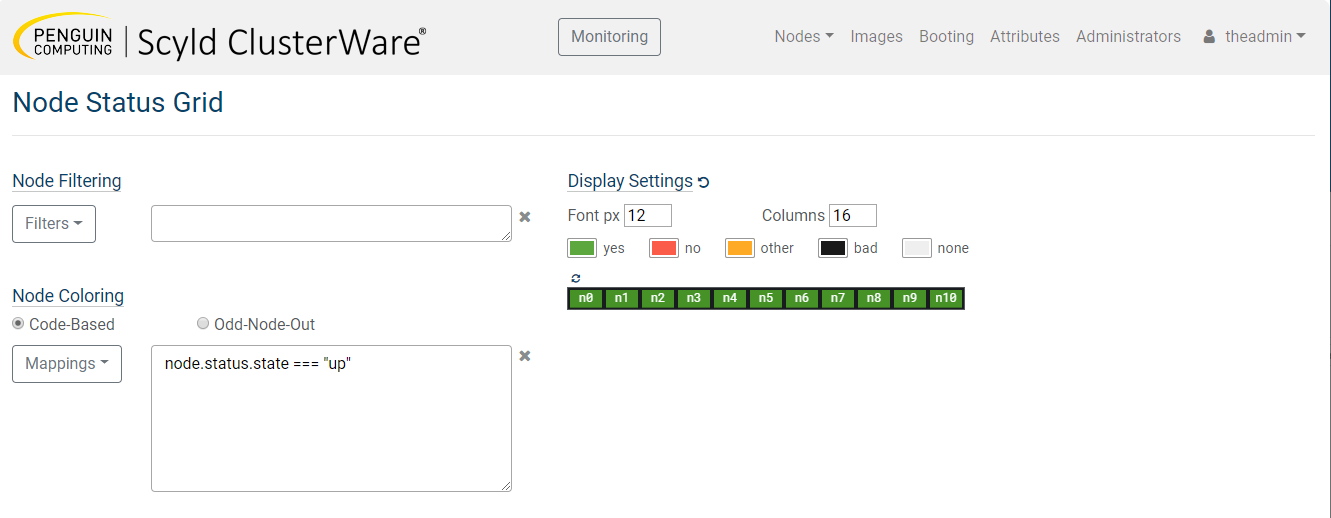
The second top-level Nodes pulldown menu choice is Status Grid.
In that window you can choose Filters to display only Up Nodes or only Down Nodes, or for Node Coloring choose the Code-Based Mappings, or for Odd-Node-Out chose one of the Variables to highlight specific out-of-the-ordinary node states.
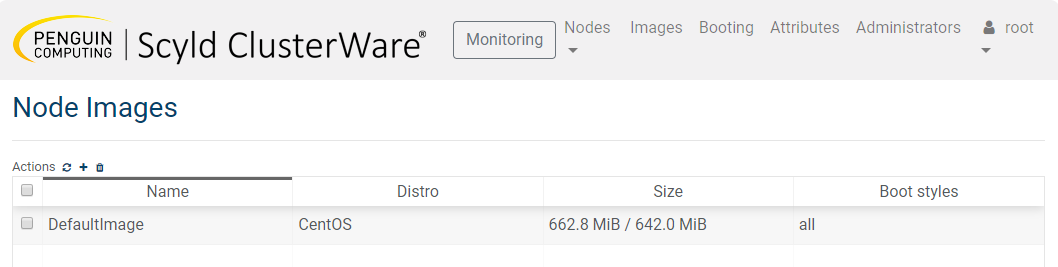
Click on the top-level Images to view the available Node Images:
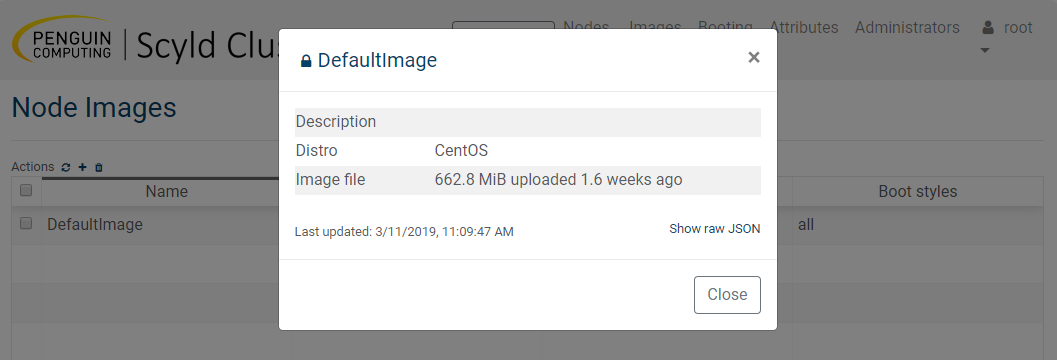
And click on a specific image to see more detail:
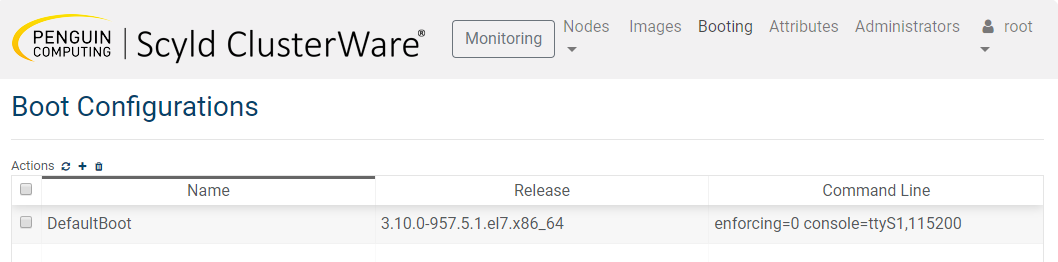
Click on the top-level Booting to view the available Boot Configurations:
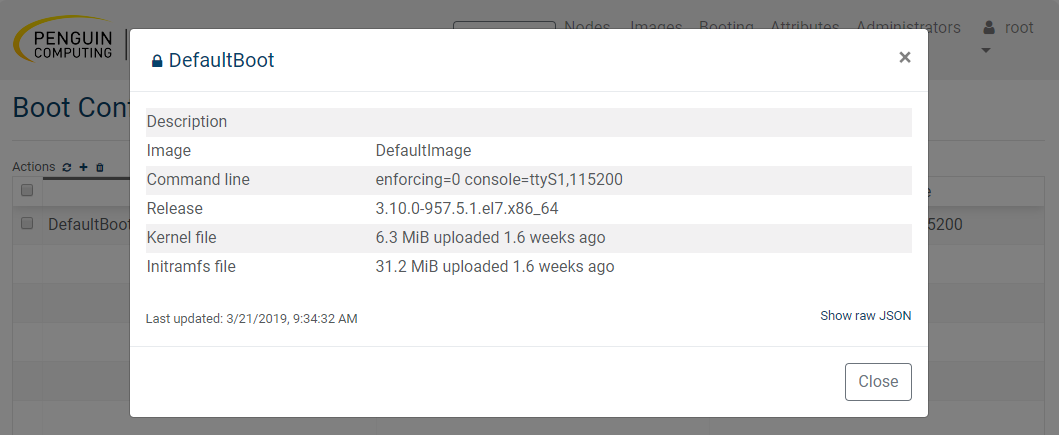
And click on a specific Boot Configuration to see details:
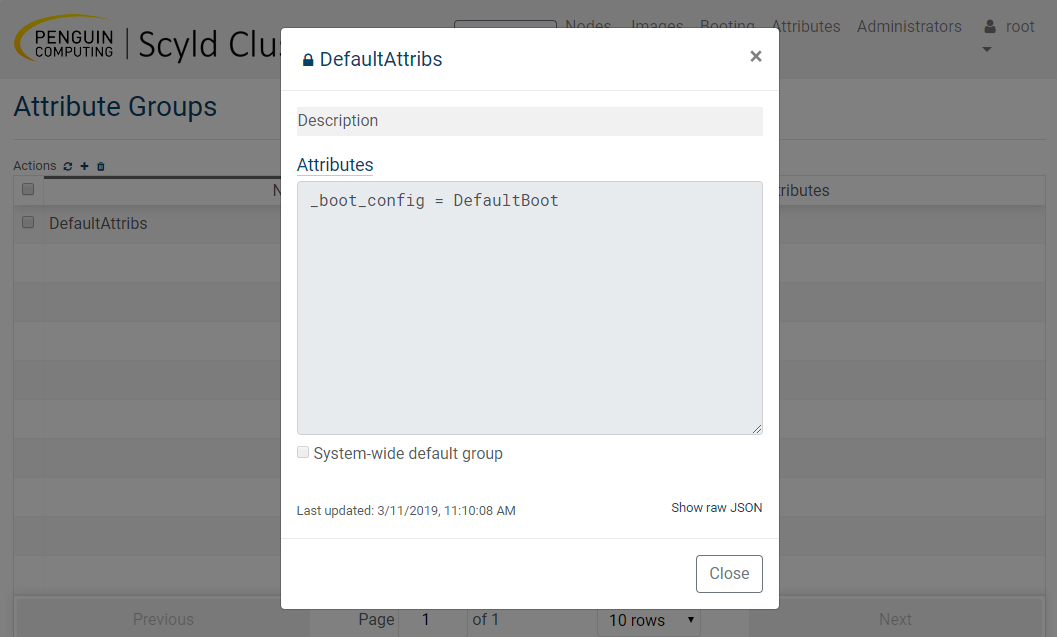
Similarly, click on the top-level Attributes to view the available Attribute Groups:
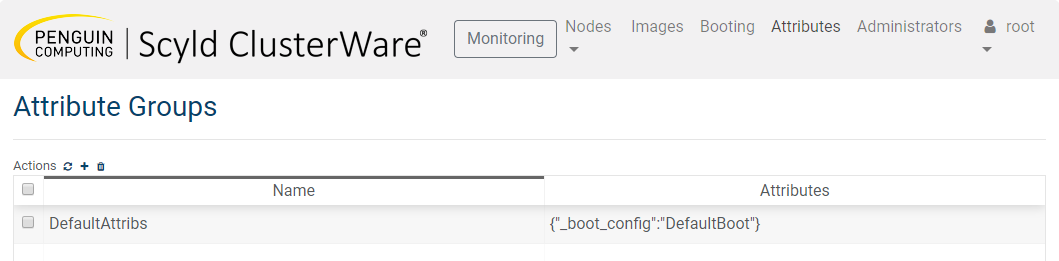
And click on a specific Attribute Group to see details: