Monitoring the Status of the Cluster
ClusterWare provides two primary methods to monitor cluster
performance and health: the command line scyld-nodectl status tool
and the more extensive Chronograf GUI.
scyld-nodectl status
More basic node status can be obtained through the scyld-nodectl
command. For example, a cluster administrator can view the status of
all nodes in the cluster:
# Terse status:
[admin@virthead]$ scyld-nodectl status
n[0] up
n[1] down
n[2] new

# Verbose status:
[admin@virthead]$ scyld-nodectl status --long
Nodes
  n0
    ip: 10.10.24.100
    last_modified: 2019-04-16 05:02:26 UTC (0:00:02 ago)
    state: up
    uptime: 143729.68

  n1
    down_reason: boot timeout
    ip: 10.10.42.102
    last_modified: 2019-04-15 09:03:20 UTC (19:59:08 ago)
    last_uptime: 59.61
    state: down

  n2: {}
From this sample output we can see that n0 is up and has recently (2 seconds earlier) sent status information back to the head node. This status information is sent by each compute node to its parent head node once every 10 seconds, although this period can be overridden with the _status_secs node attribute. The IP address shown here is the IP reported by the compute node and should match the IP provided in the node database object unless the database has been changed and the node has not yet been rebooted.
Compute node n1 is currently down because of a "boot timeout".
This means that the node attempted to boot, and the node's initial
"up" status message to the head node was not received.
This could happen
due to a boot failure such as a missing network driver, a networking
failure preventing the node from communicating with the head node, or
if the cw-status-updater service provided by the
clusterware-node package is not running on the compute node.
Other possible values for down_reason include "node stopped
sending status" or "clean shutdown".
There is no status information about n2 because it was added to the
system and has never been booted. Additional node status can be viewed
with scyld-nodectl status -L (an abbreviation of --long-long)
that includes the most recent full
hostname, kernel command line, loaded modules, loadavg, free RAM,
kernel release, and SELinux status. As with other scyld-*ctl
commands, the output can also be provided as JSON to simplify parsing
and scripting.
For large clusters the --long (or -l) display can be unwieldy,
so the status command defaults to a summary.
Each row of output corresponds to a different node status and lists
the nodes in a format that can then be passed to the --ids
argument of scyld-nodectl. Passing an additional --refresh
argument will cause the tool to start an ncurses application that will
display the summary in the terminal and periodically refresh the
display:
scyld-nodectl status --refresh
This mode can be useful when adding new nodes to the system by booting them one at a time as described in Node Creation with Unknown MAC address(es).
Chronograf GUI
Access the Chronograf GUI through the ClusterWare GUI's "Monitoring" tab (see Graphical Interface). If the local server is a head node, you can use http://localhost/chronograf. To connect to another database-accessible node, e.g., named cwheadnode2, you can use http://cwheadnode2/chronograf.
Note
The URL http://cw11headnode/chronograf may differ if the cluster administrator has switched to HTTPS or otherwise modified the Apache configuration.
See https://docs.influxdata.com/chronograf/v1.7/ for
extensive documentation about how to craft site-specific visualizations of
cluster activity and status.
To facilitate monitoring of compute node GPU activity,
first install into the GPU compute node image(s)
the NVidia System Management Interface utility (nvidia-smi),
which ships with NVidia GPU drivers.
See https://developer.nvidia.com/nvidia-system-management-interface
for details of that utility, and see
https://www.cyberciti.biz/faq/how-to-install-nvidia-driver-on-centos-7-linux/
for a description of how to install NVidia drivers.
Then in the compute node image(s) copy
/etc/telegraf/telegraf.d/nvidia-smi.conf.example
(distributed in the clusterware-node RPM) to
/etc/telegraf/telegraf.d/nvidia-smi.conf.
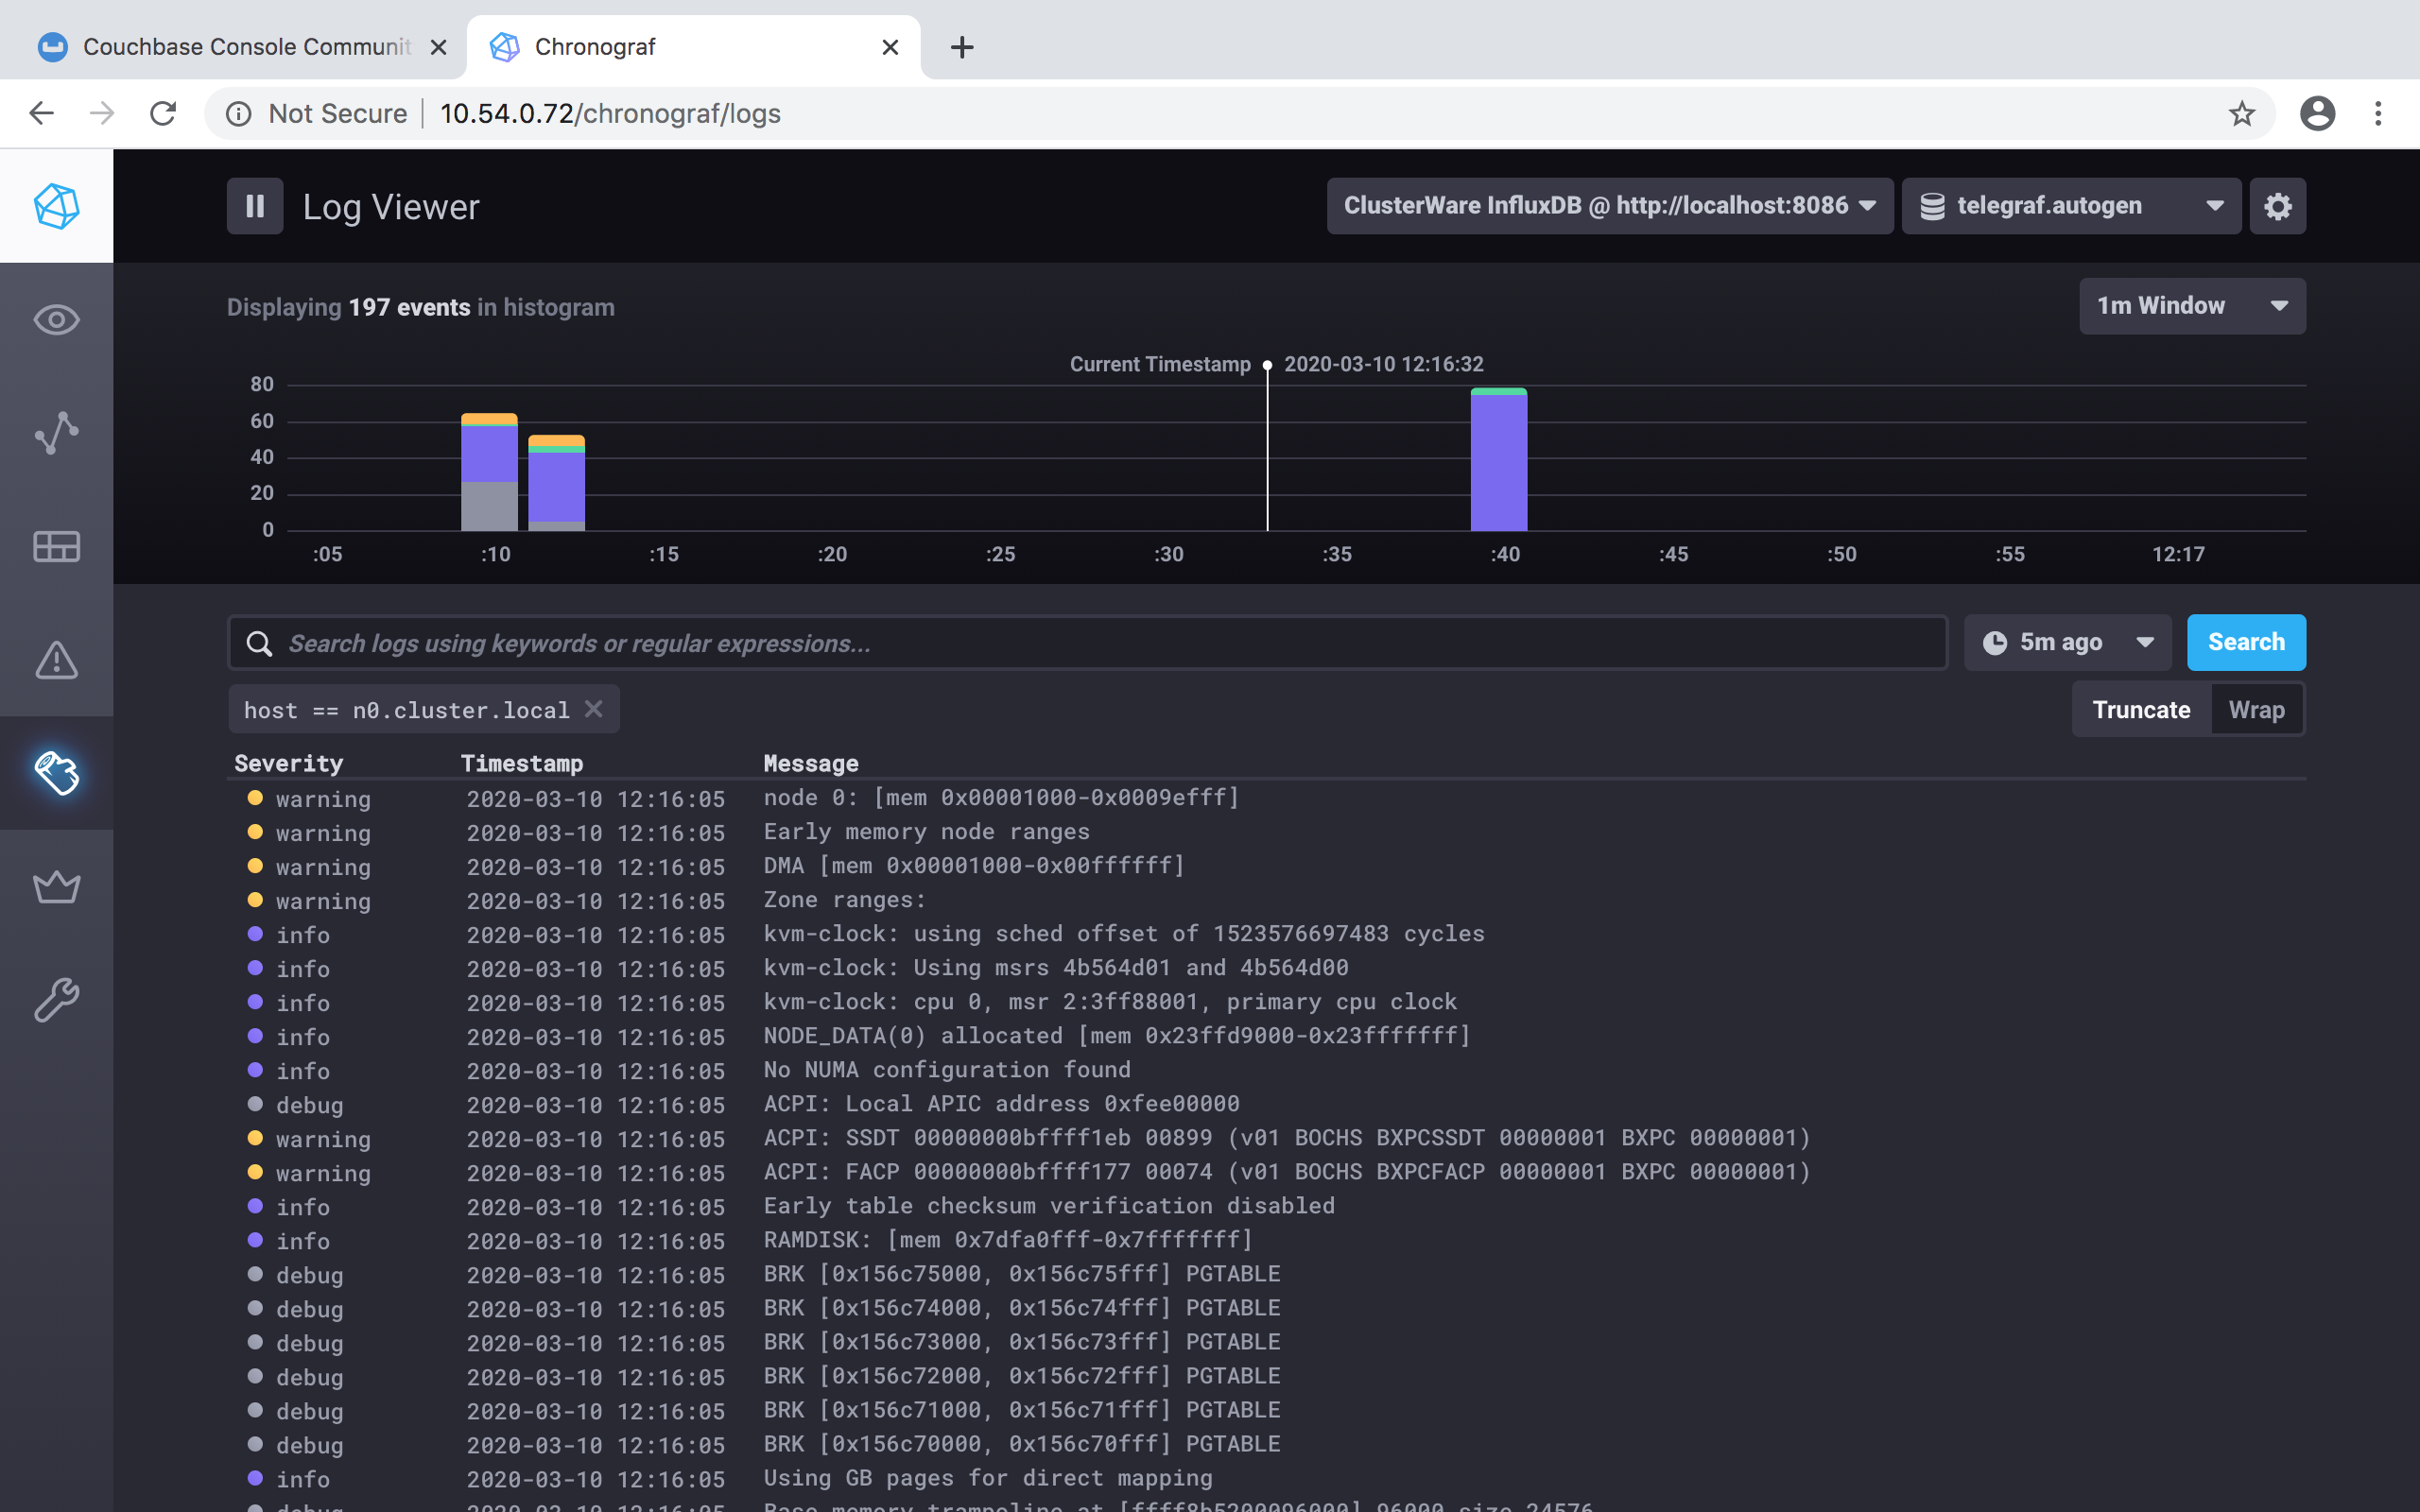
In a browser click on the Log Viewer button on the left side of the window to see the head node and/or compute nodes' rsyslog.
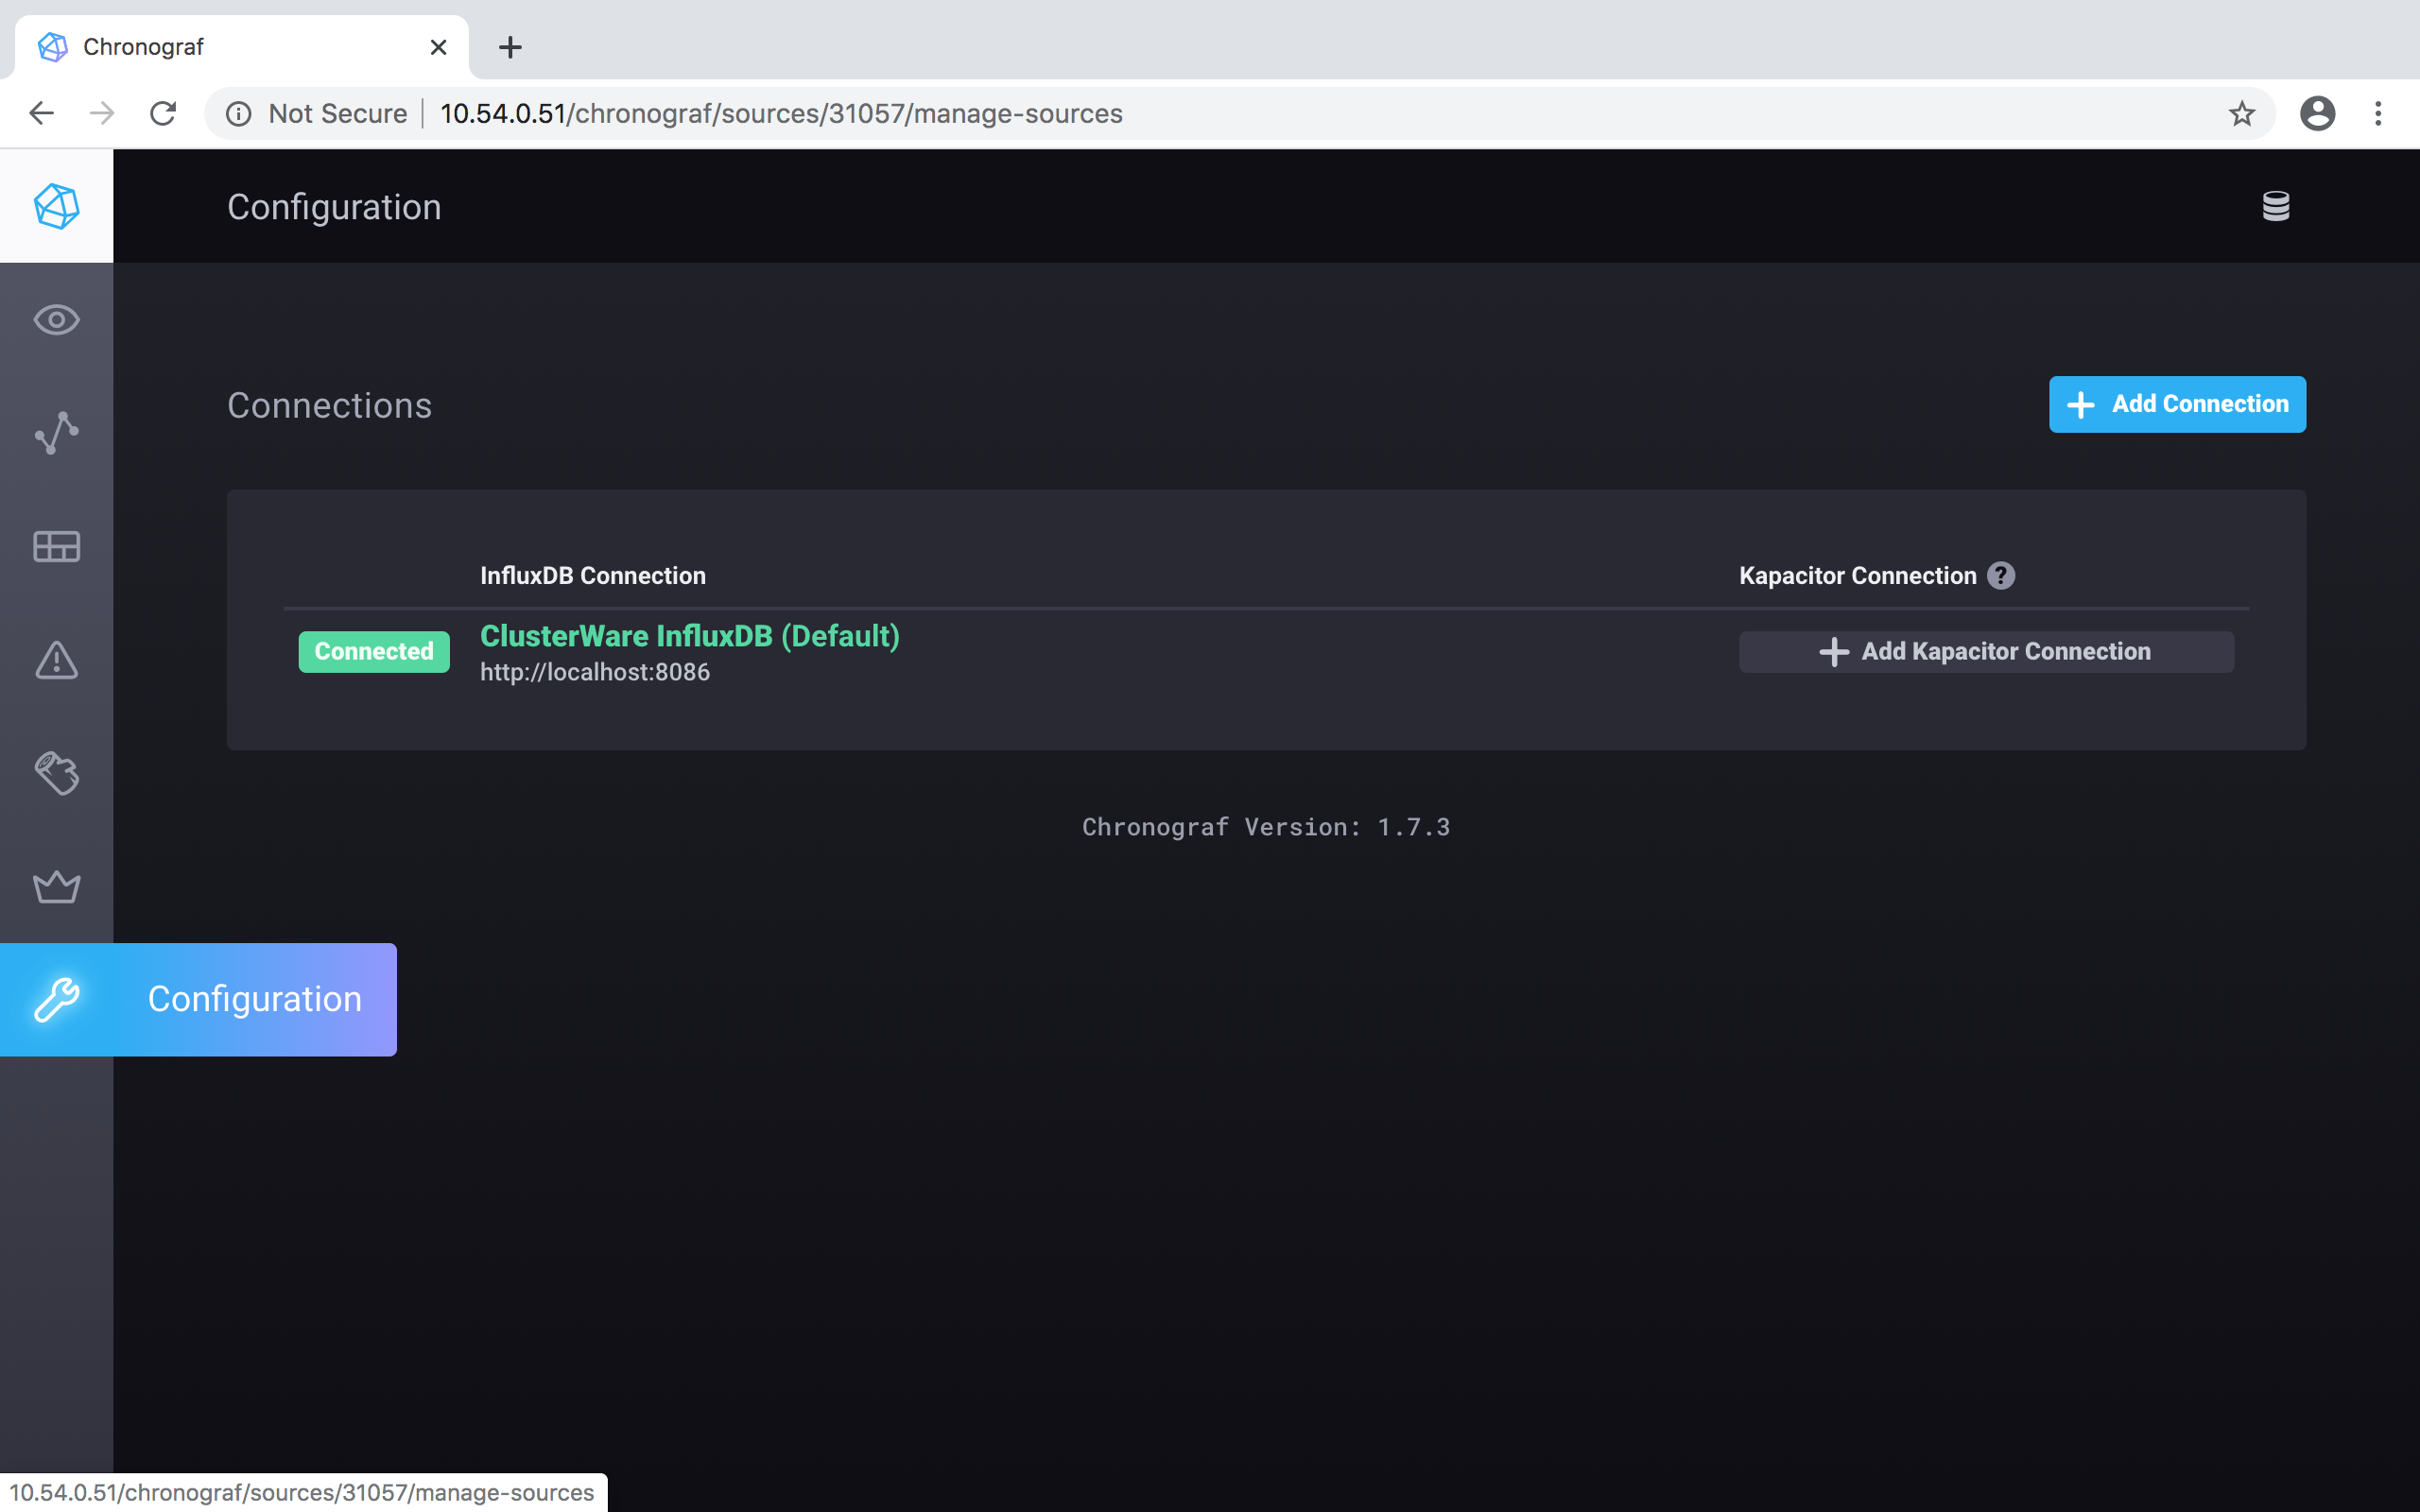
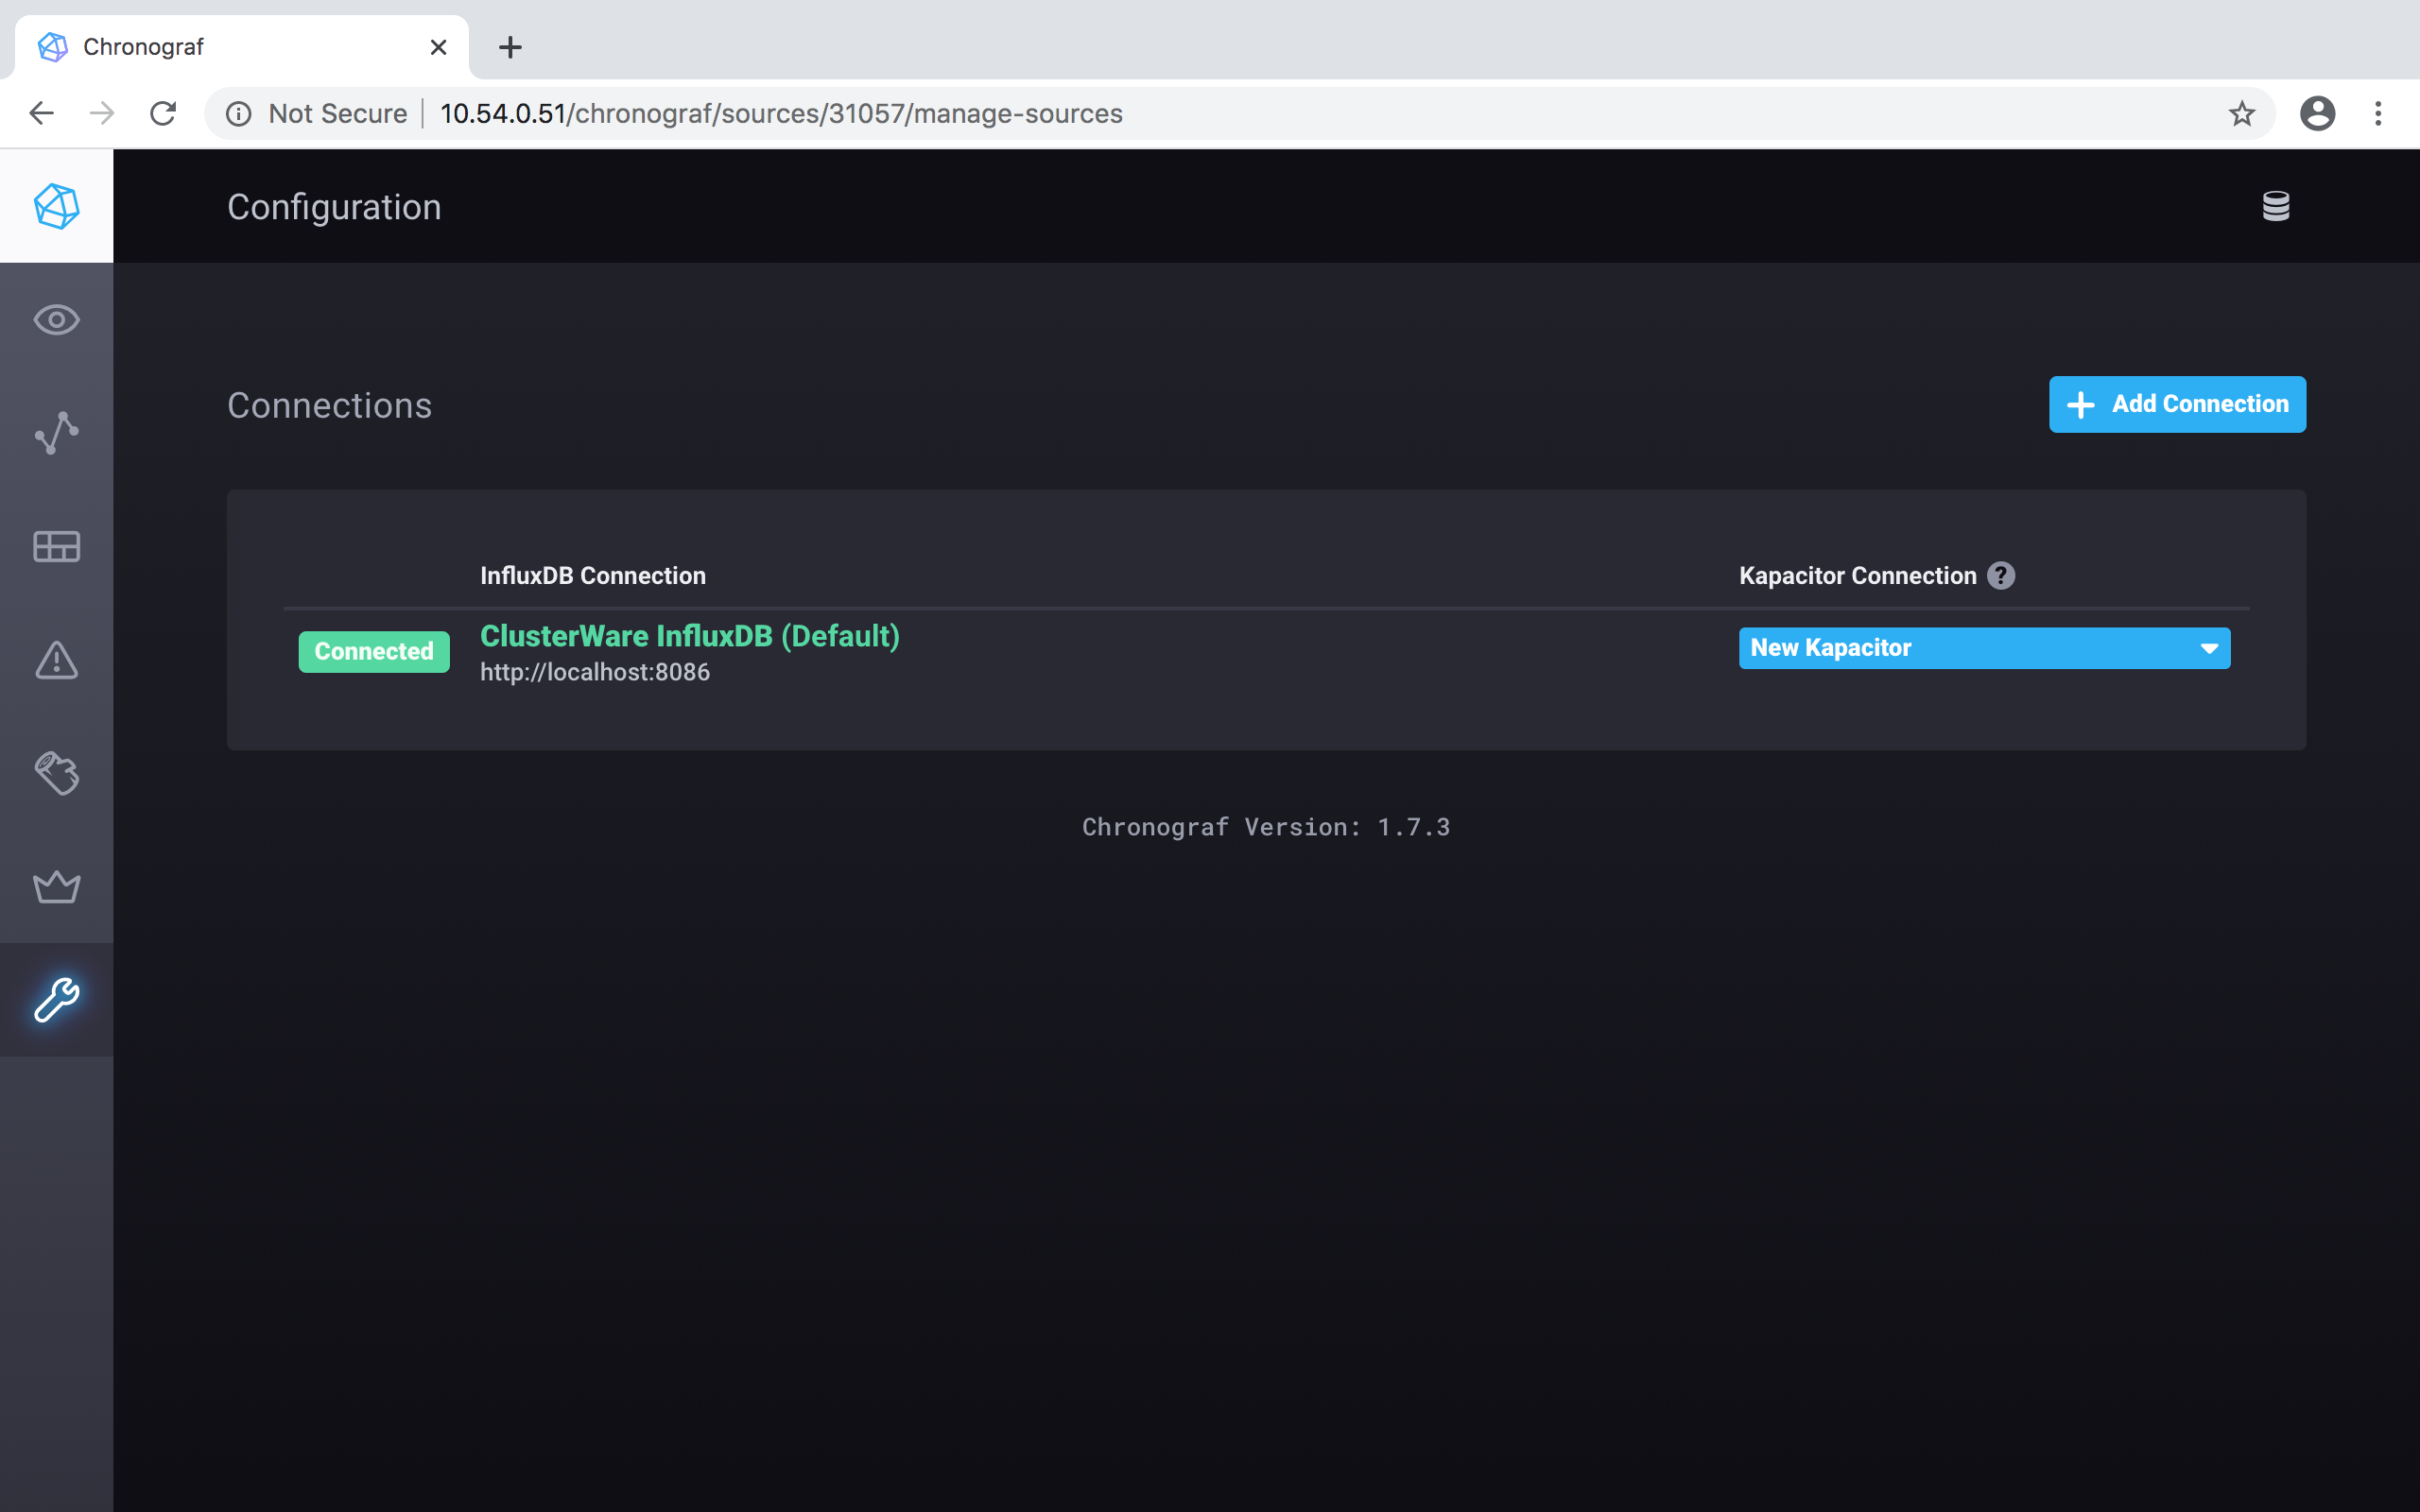
To perform a simple setup, point your browser at http://localhost/chronograf, then click on the Configuration button at the lower left of the window (highlighted in blue as you pass your cursor over the vertical set of icons), On that Configuration screen, click on the green ClusterWare InfluxDB (Default) button:
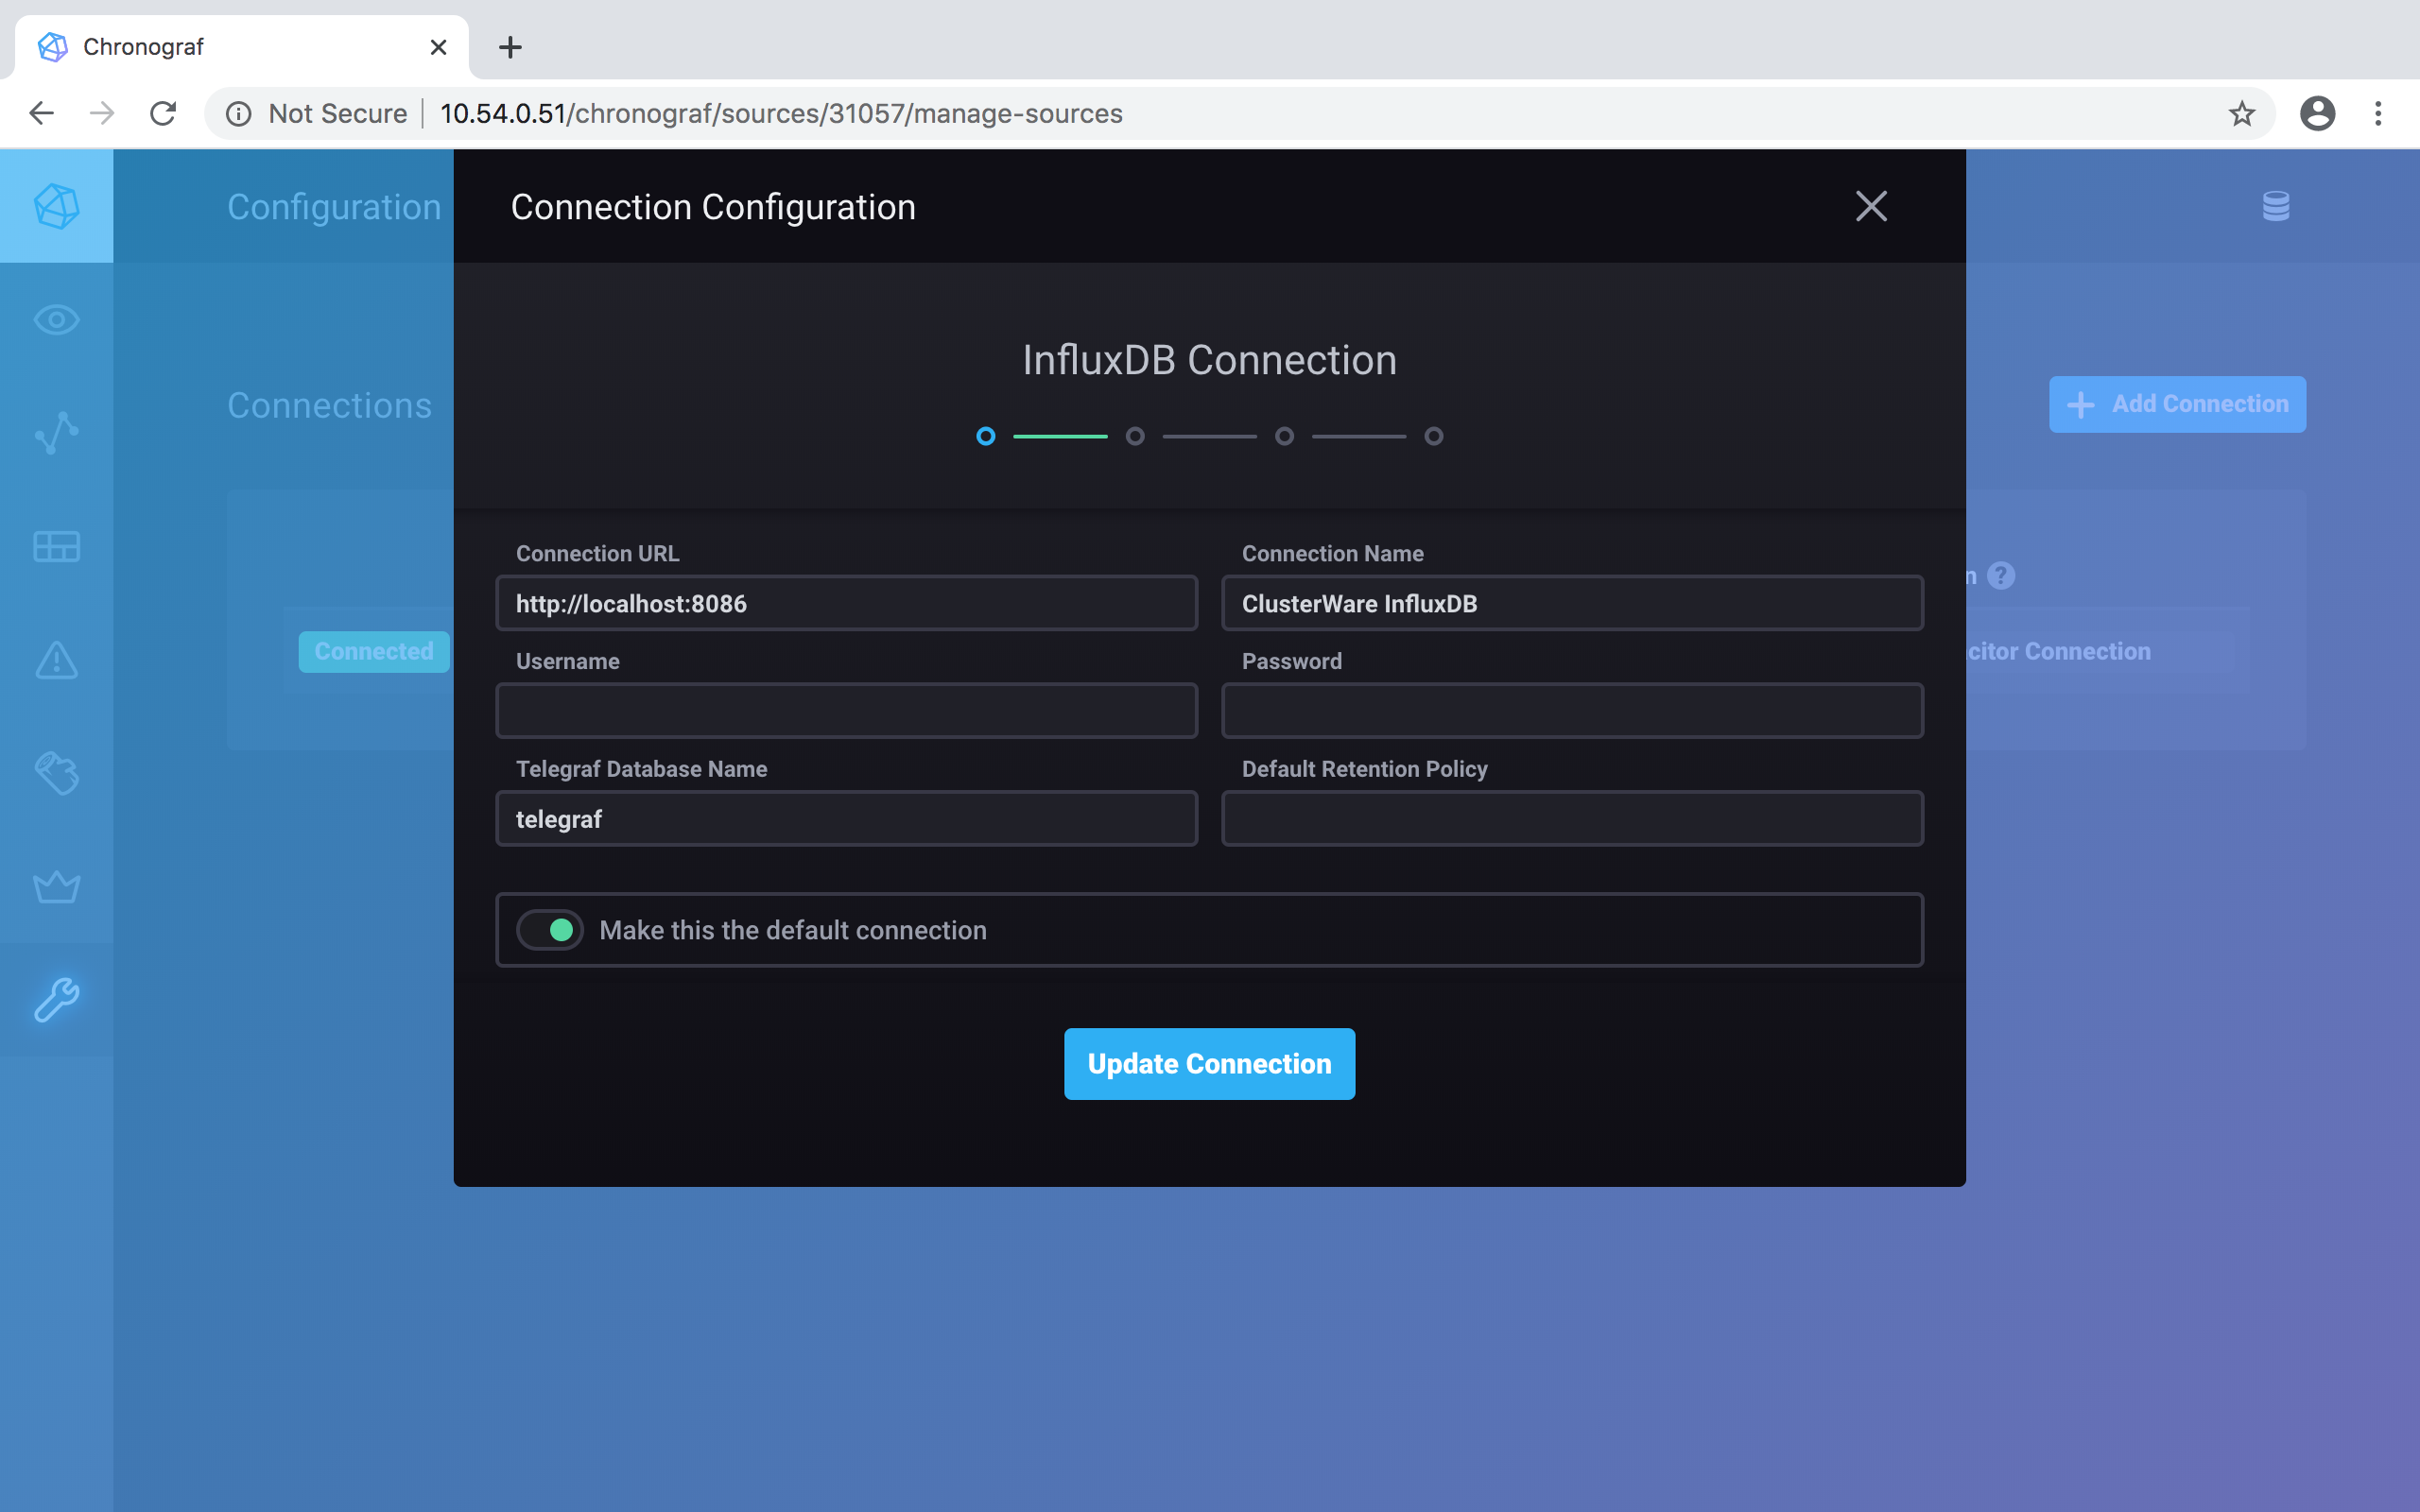
The initial installation should have set up the connection to the database. Click on the blue Update Connection button to accept:
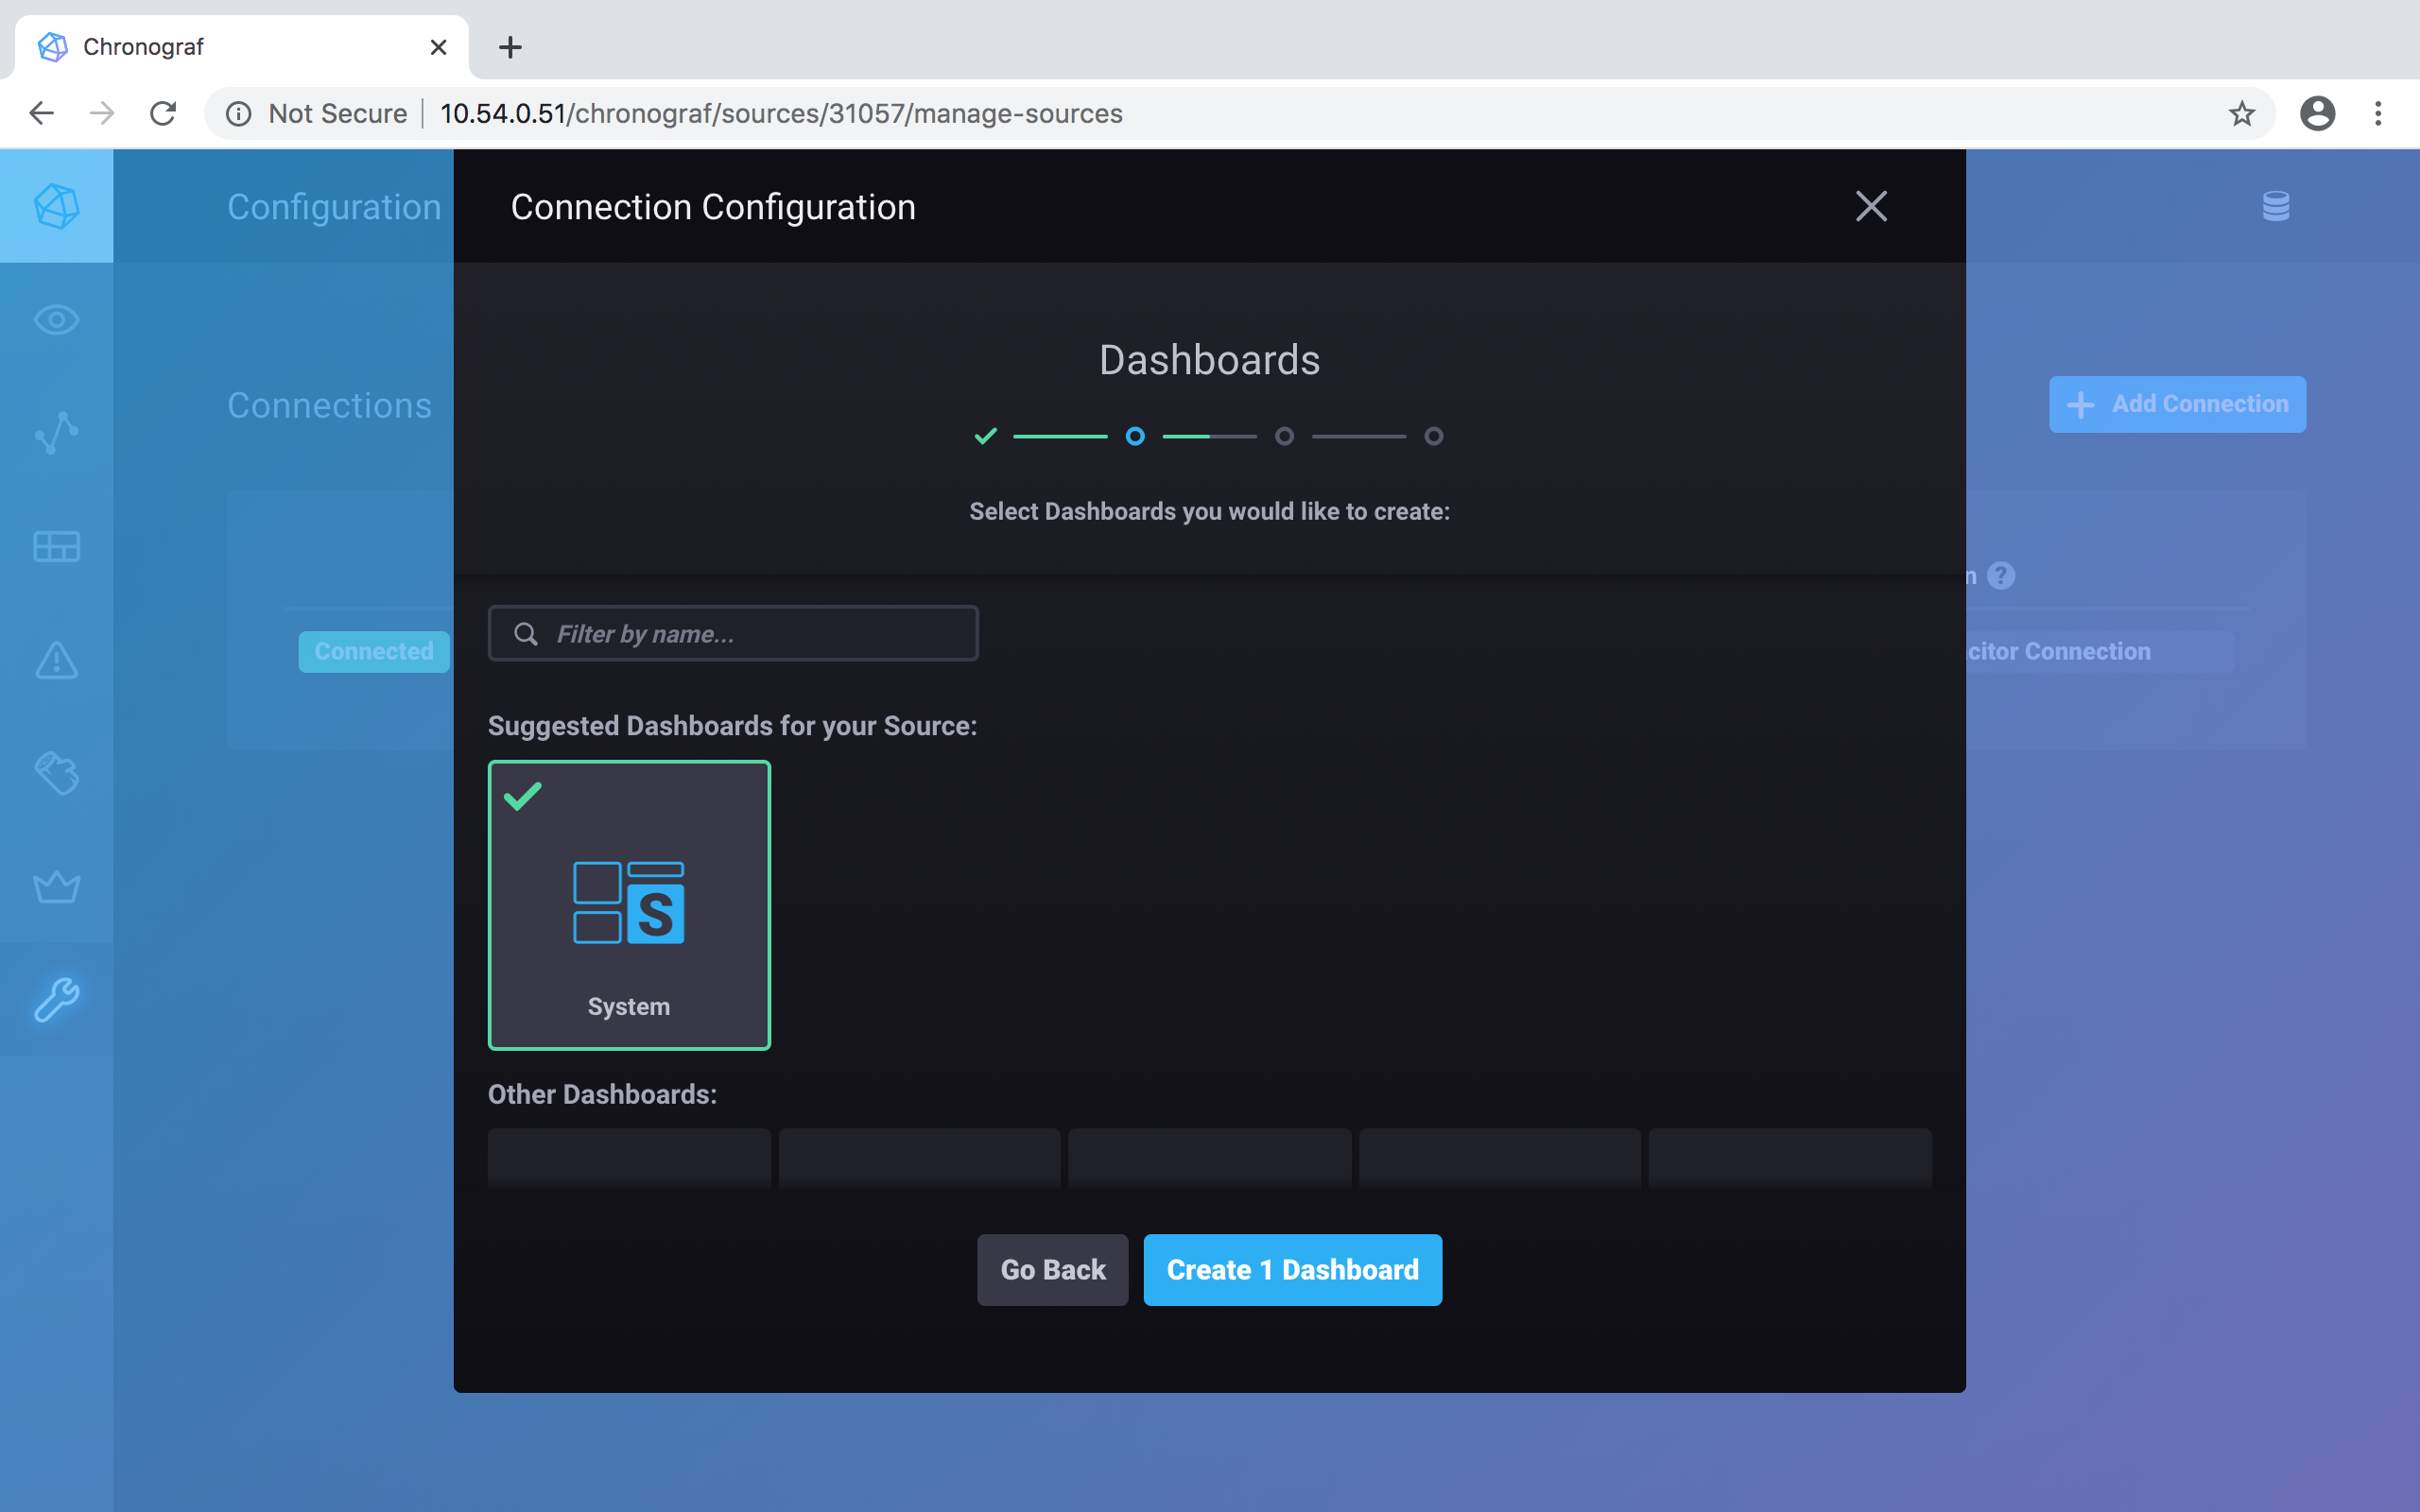
Click on the System dashboard to select it, then click on Create 1 Dashboard to create it:
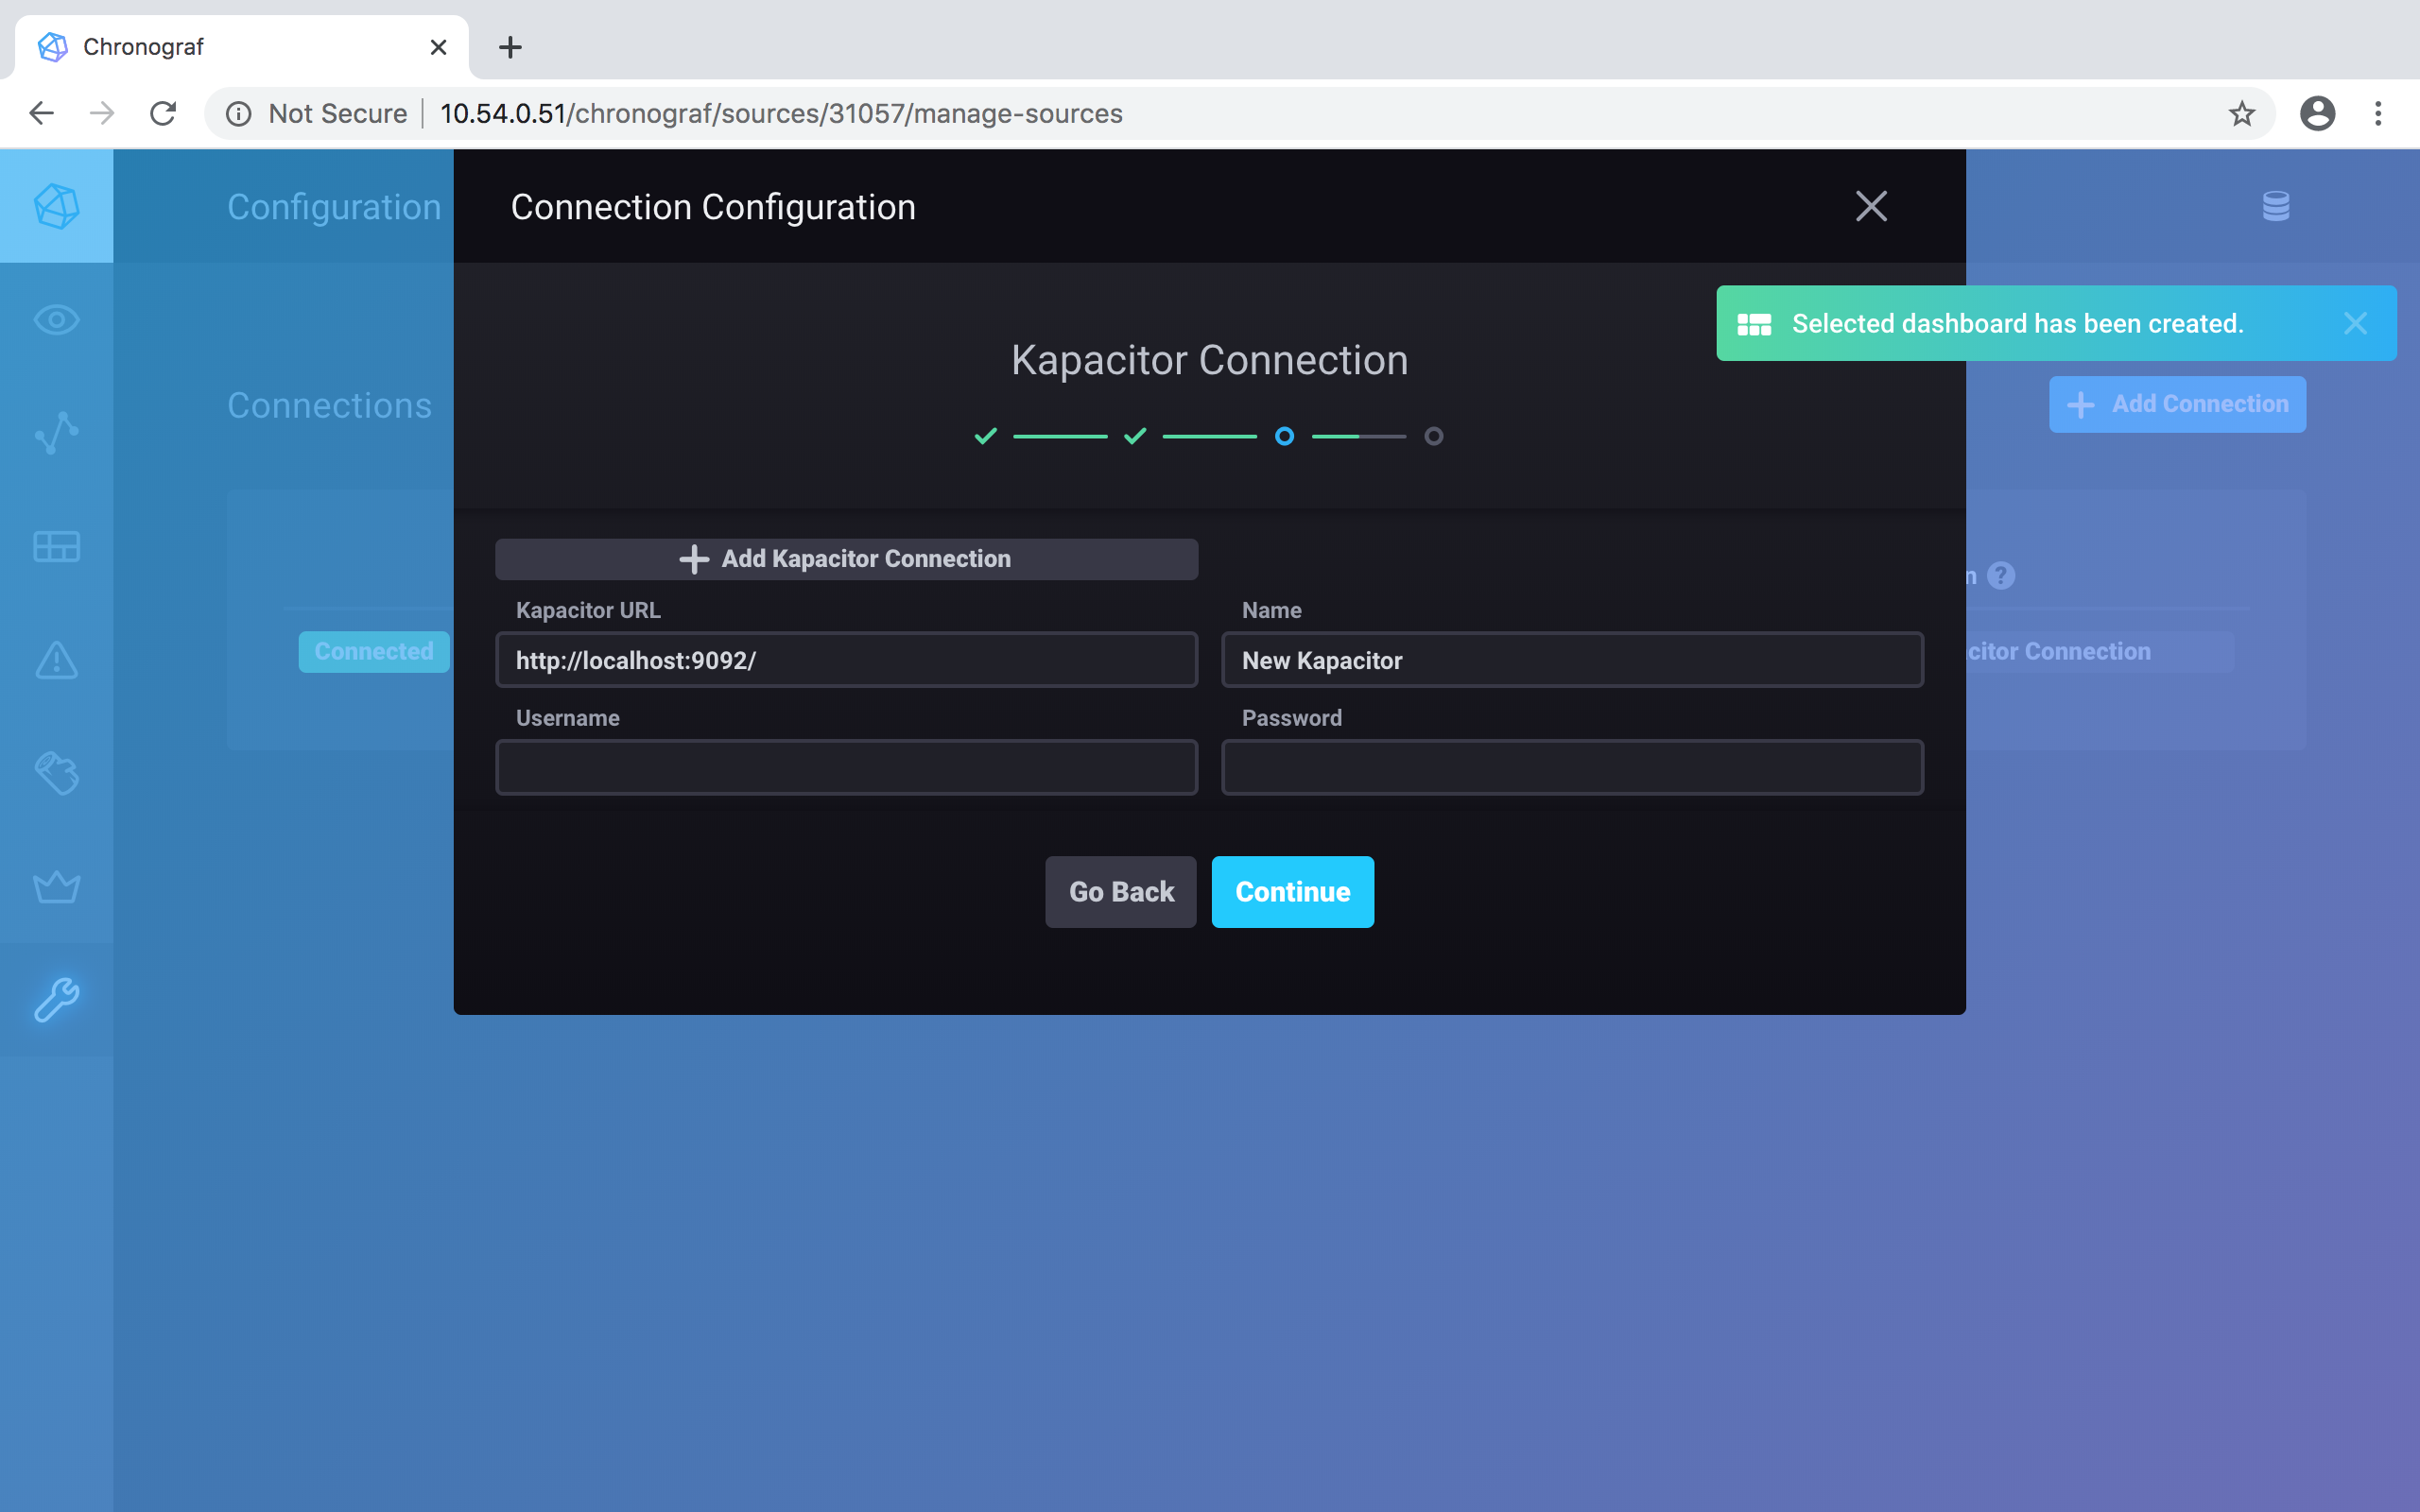
Now confirm the Kapacitor connection to the database. Click on the blue Continue button:
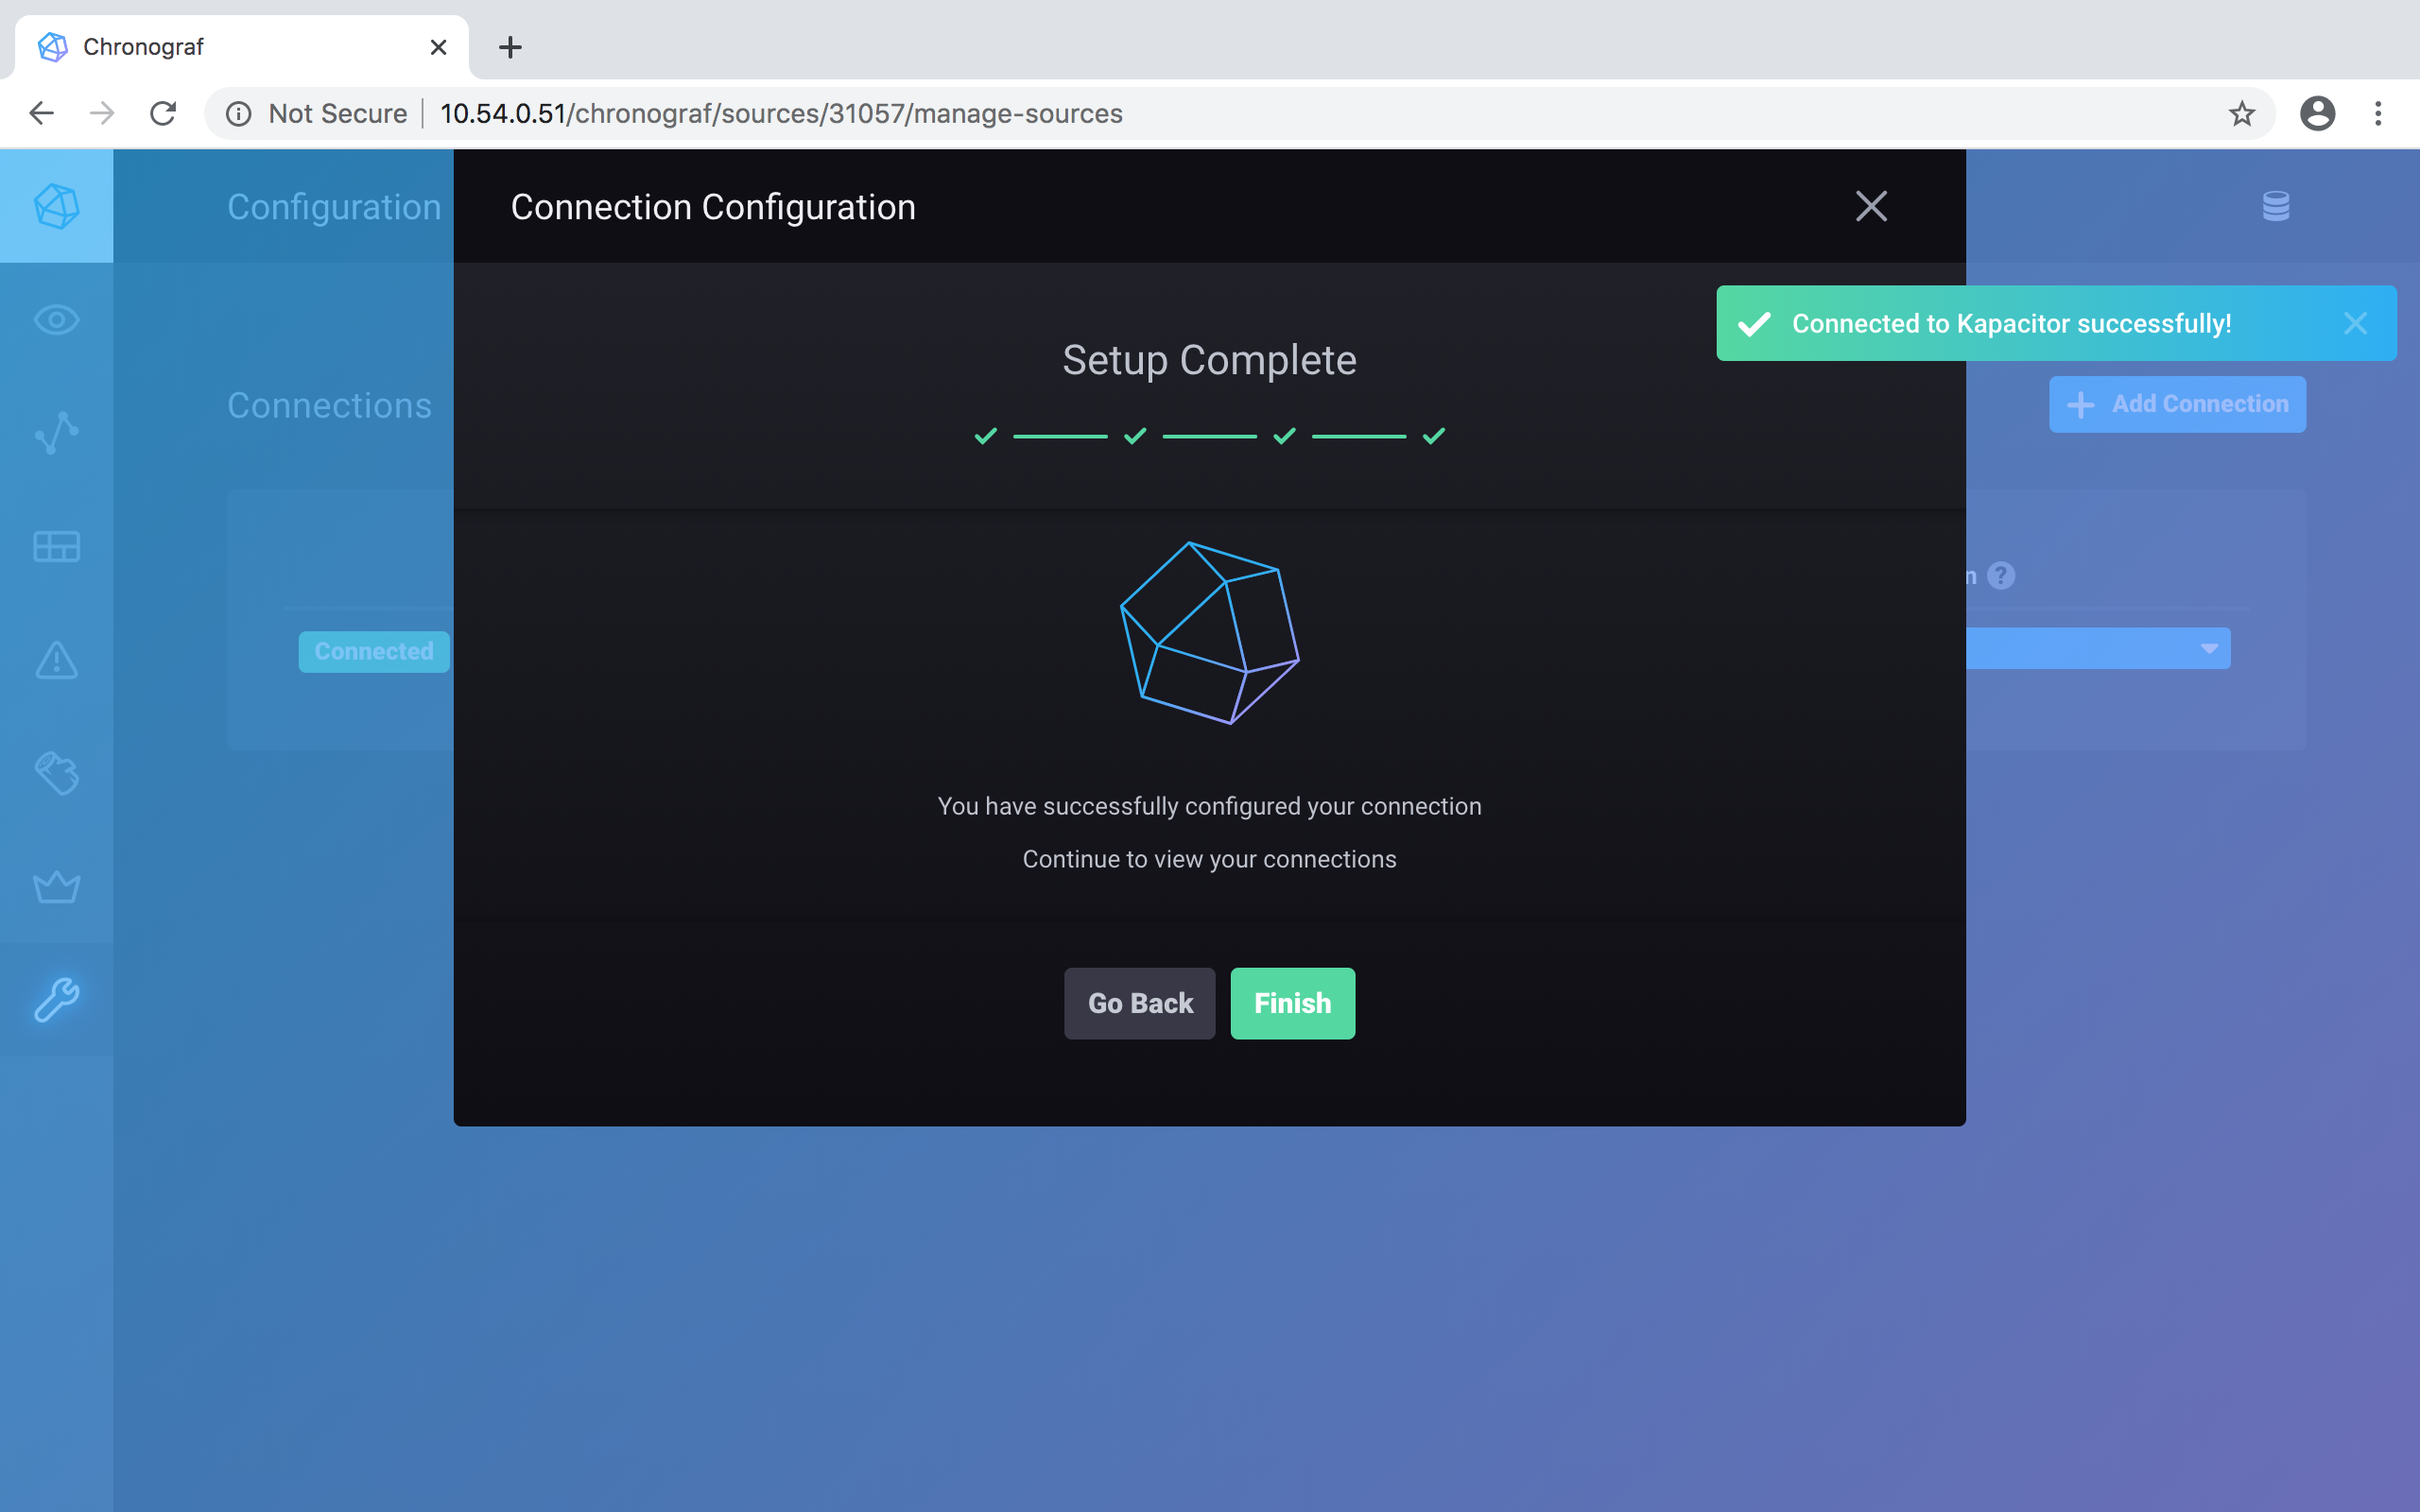
And your setup is complete. Click on the green Finish button to confirm:
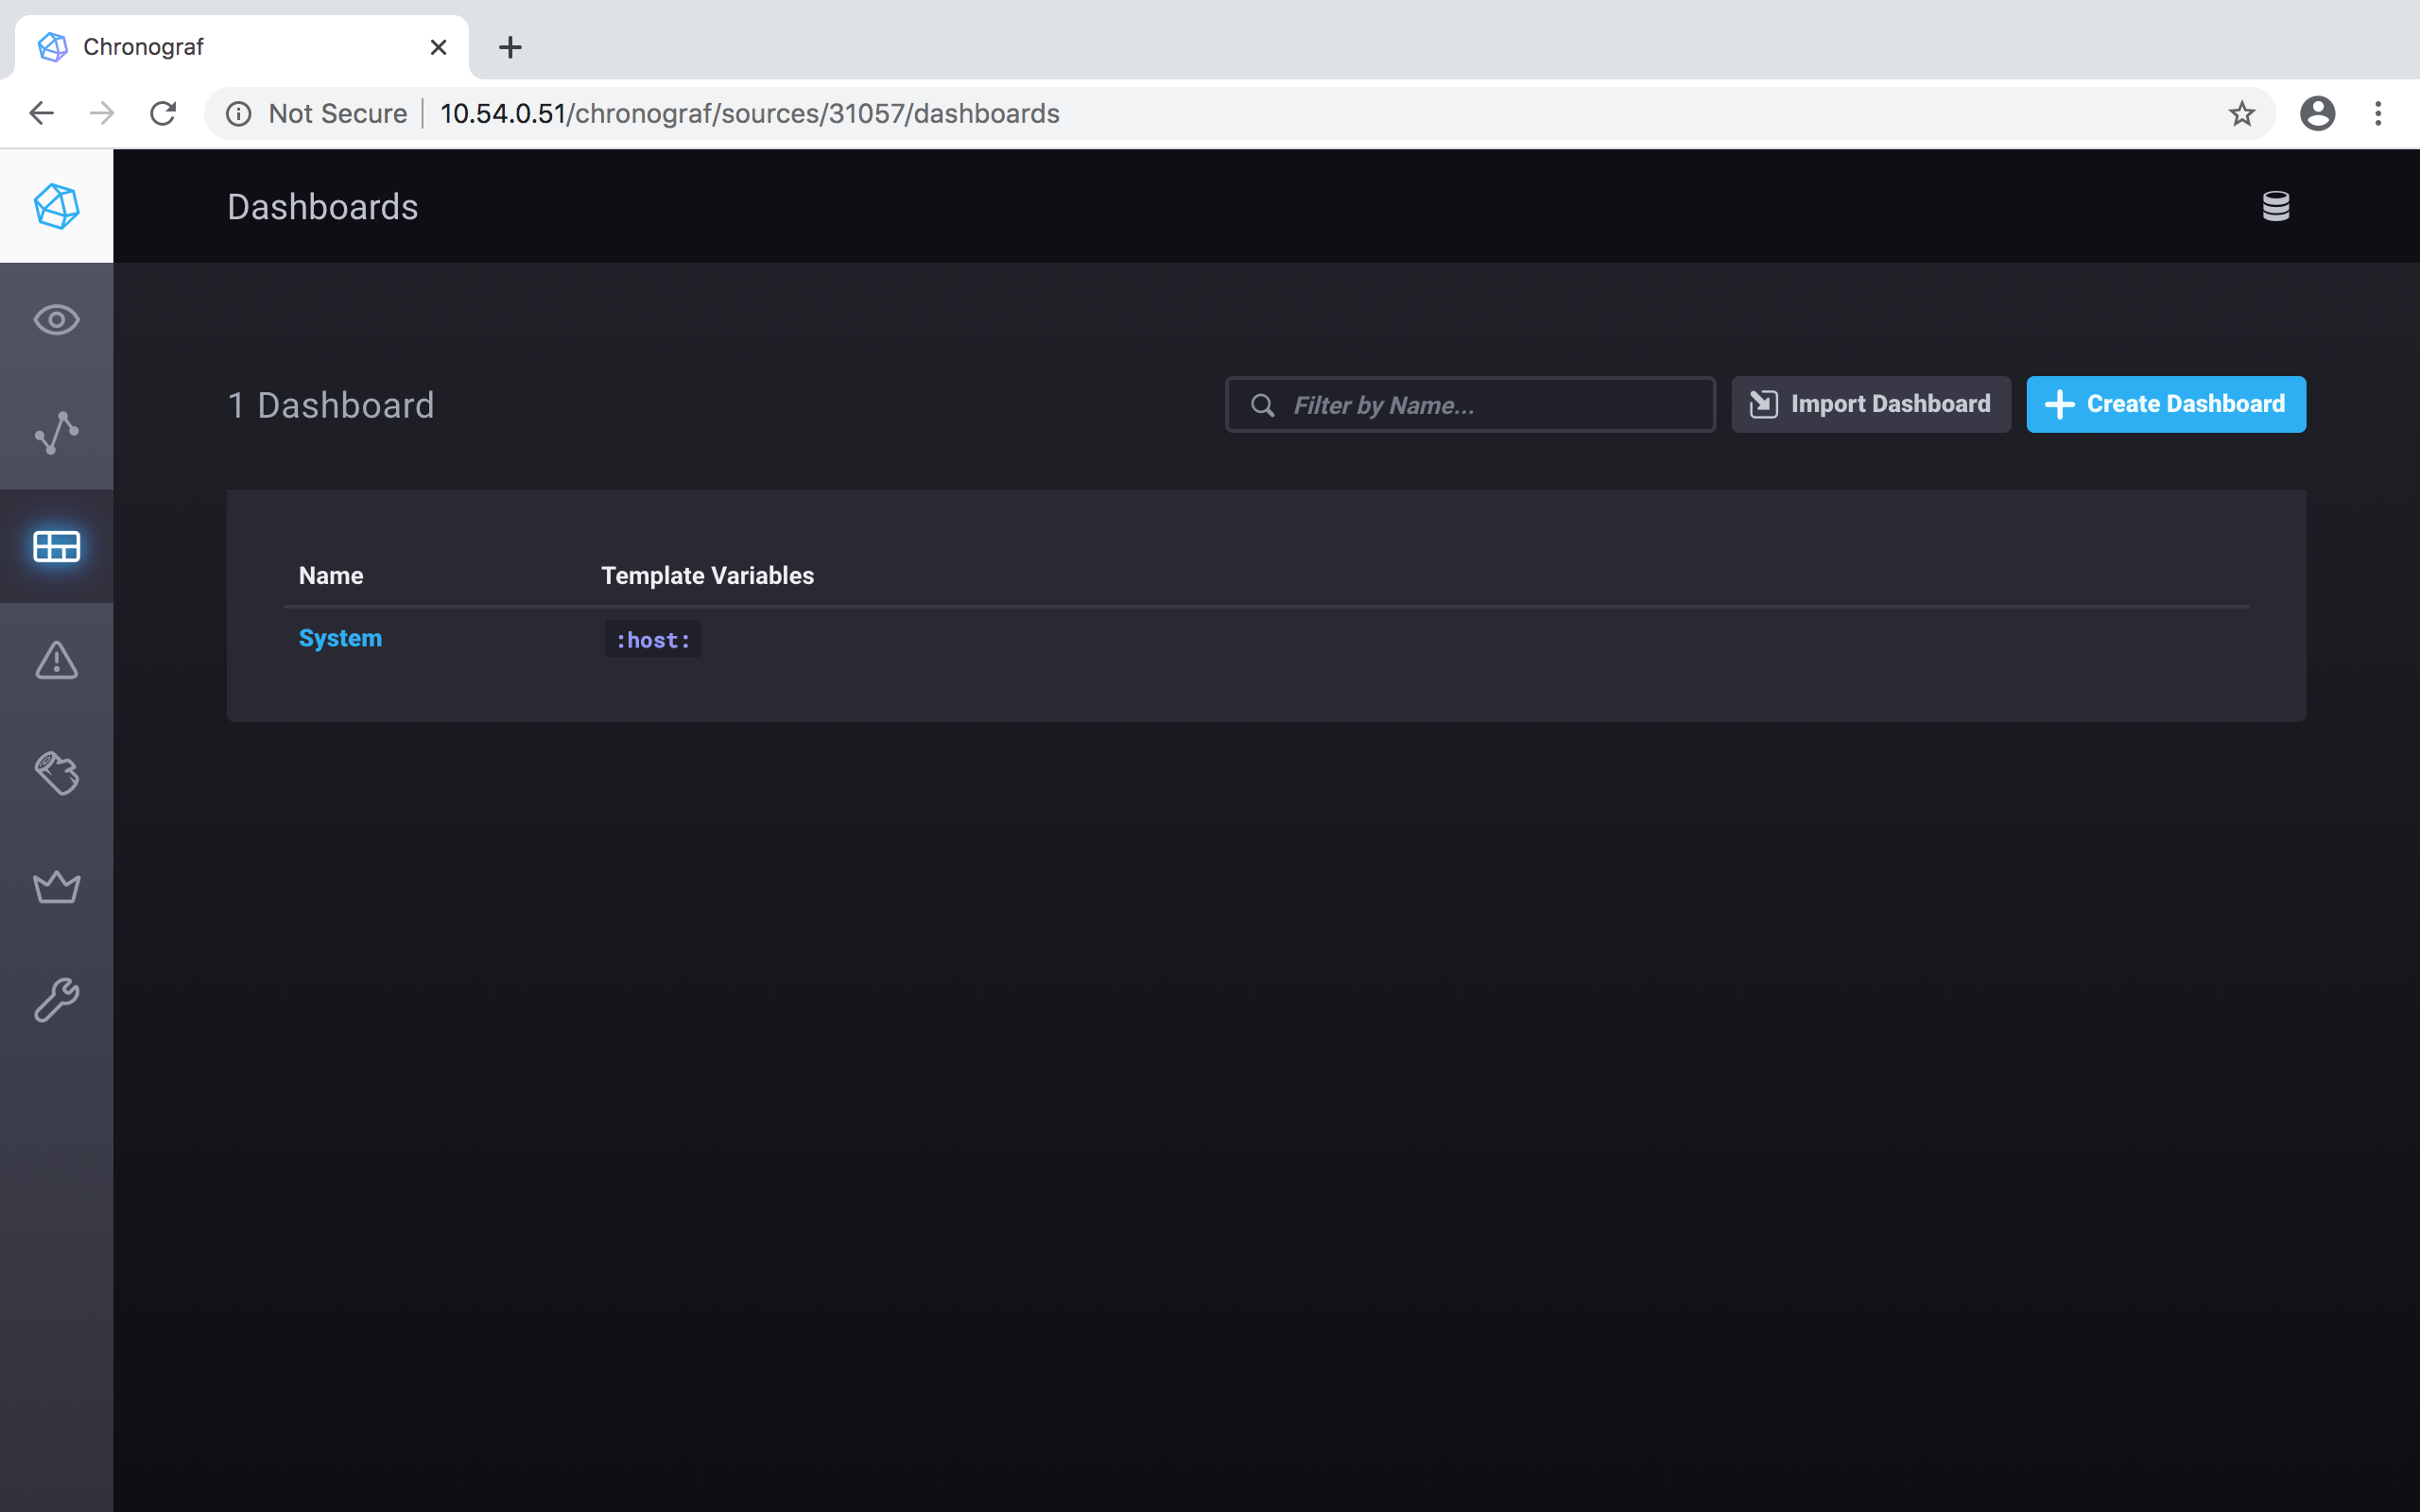
Back to the initial Chronograf window, click on the Dashboards button (highlighted in blue as you pass your cursor over the vertical set of icons), on the left side of the window:
And you see the System dashboard that was just set up, and its "Template Variables" is :host::
Click on the System dashboard to view it:
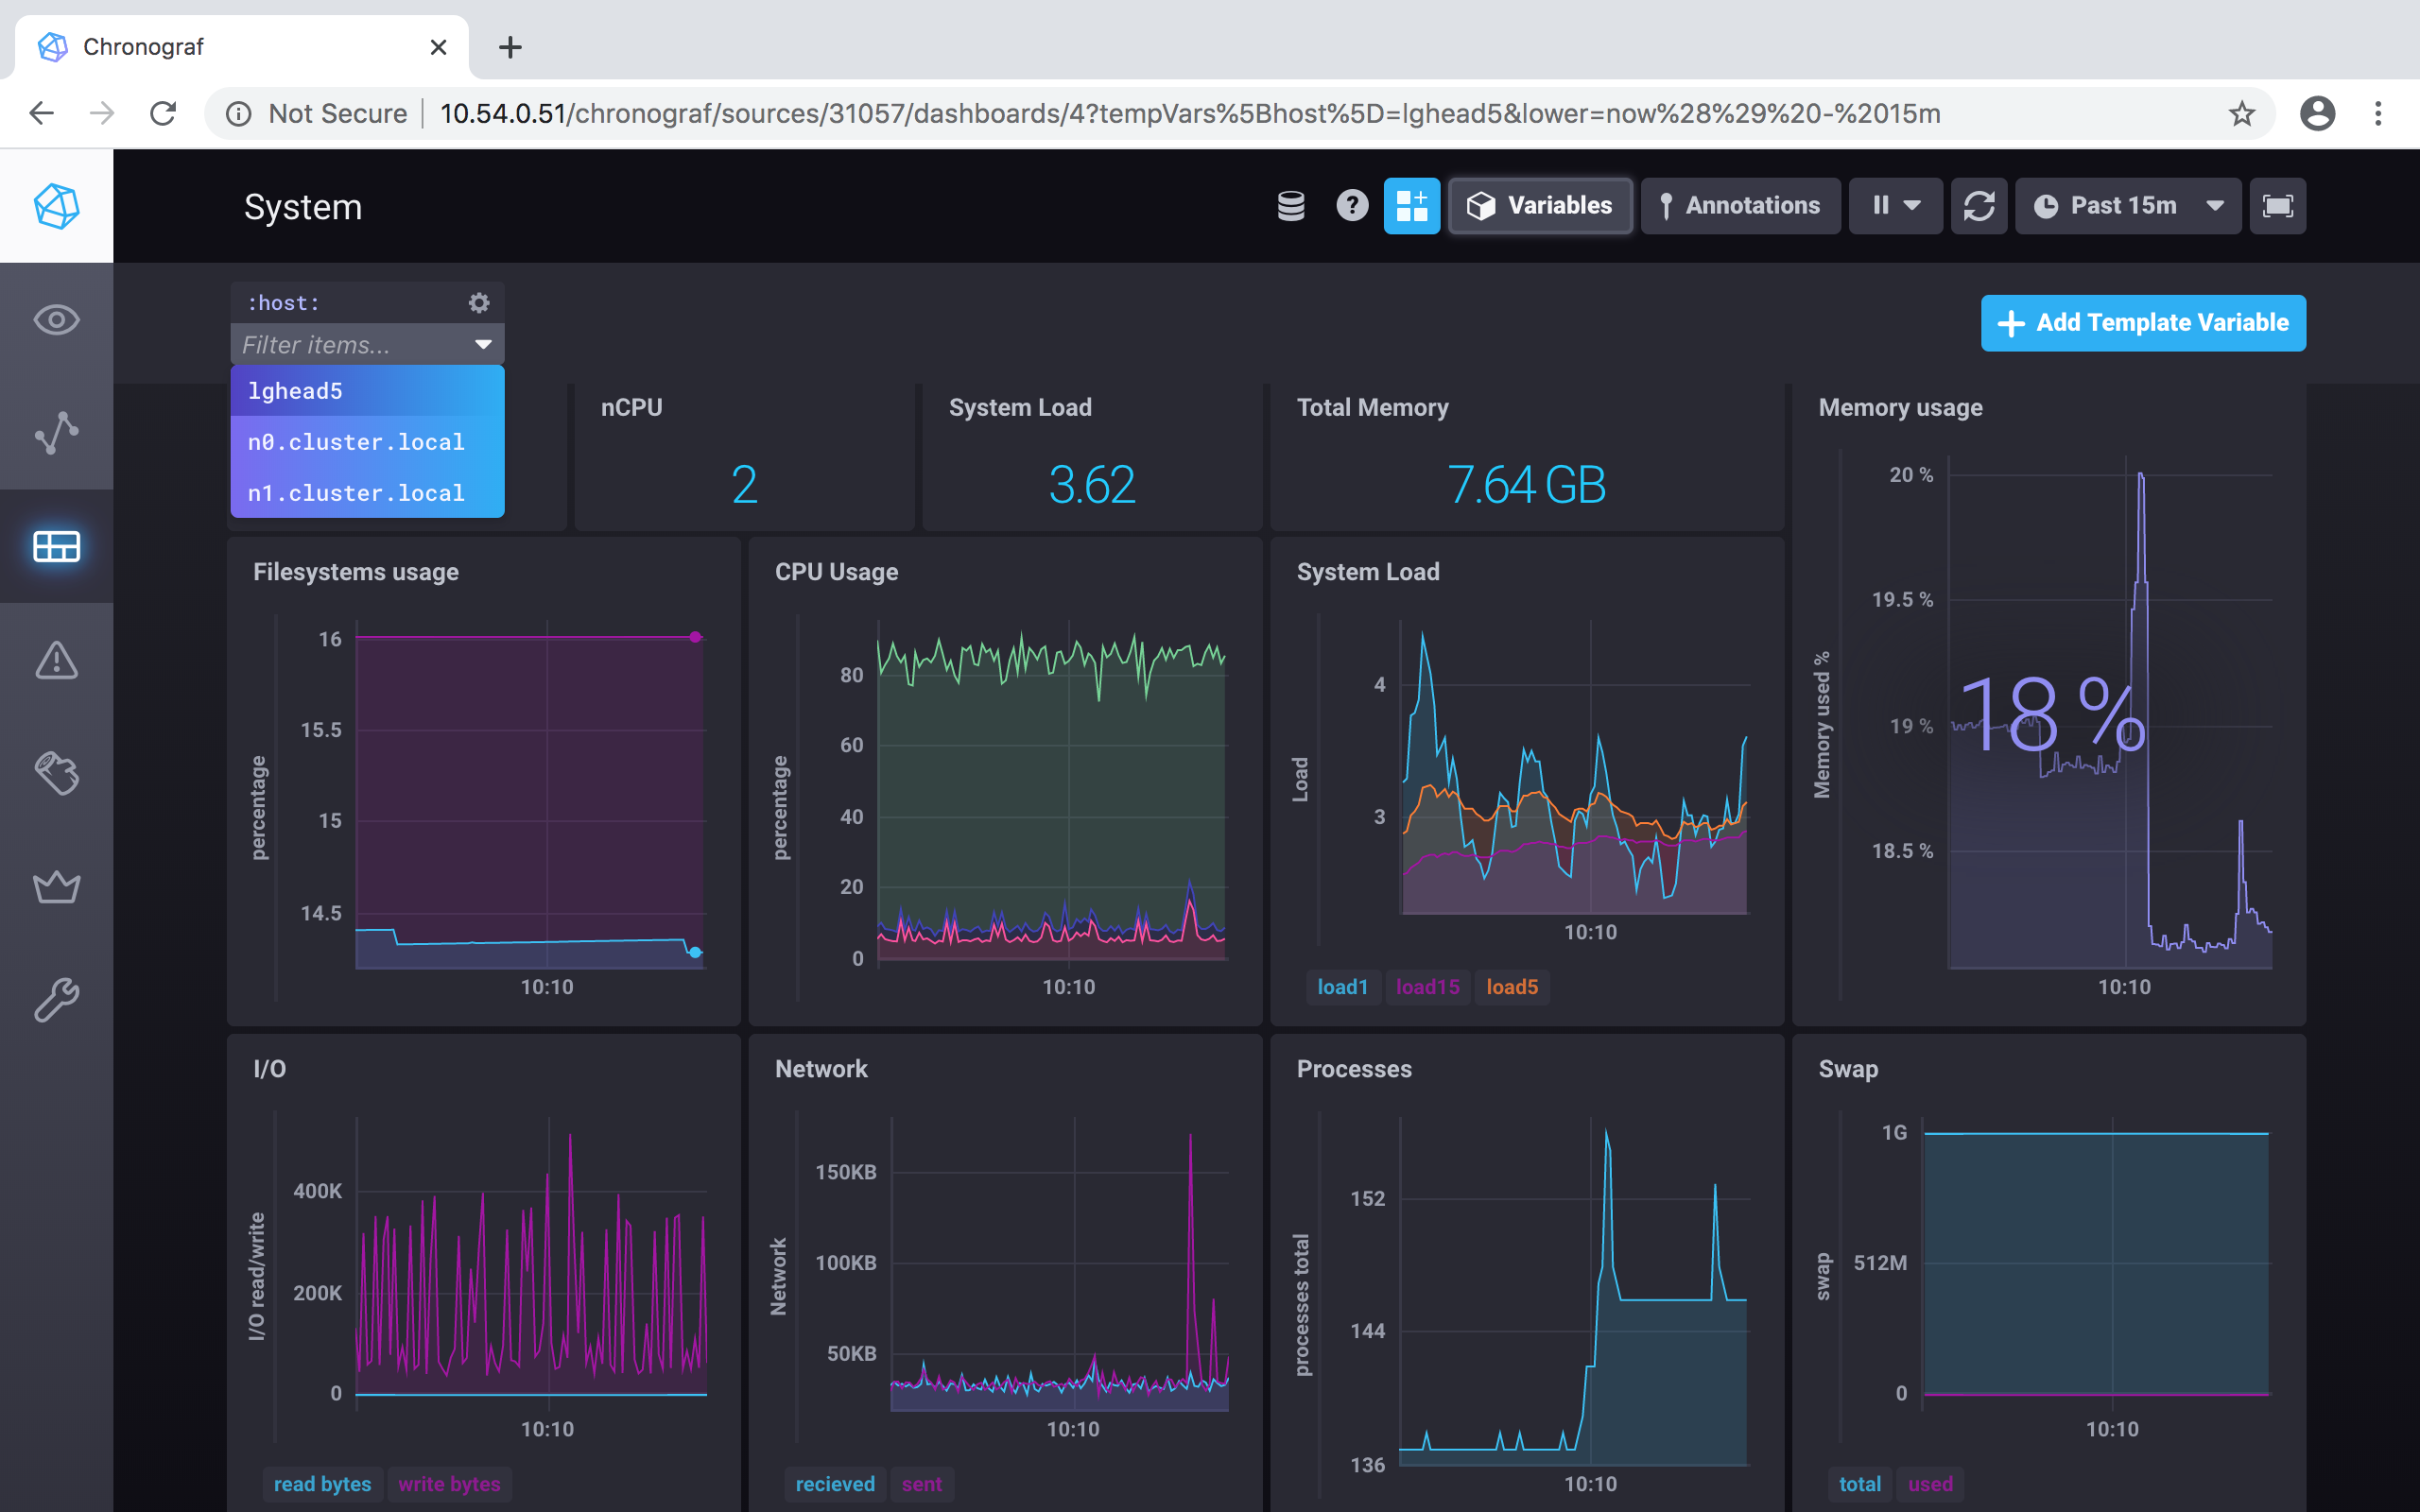
Note the :host: in the upper left of the window, which is a pulldown menu that shows the choices of which node to view. In this example there is a head node and two compute nodes.
Click on the Log Viewer button on the left side of the window to see the logs: