Interacting With the System
This chapter discusses how to verify the availability of the nodes in your cluster, how to monitor node status, how to issue commands and copy data to the compute nodes, and how to monitor and control processes. For information on running programs across the cluster, see Running Programs.
Verifying the Availability of Nodes
In order to use a Scyld cluster for computation, at least one node must be available or up. Thus, the first priority when interacting with a cluster is ascertaining the availability of nodes. Unlike traditional Beowulf clusters, Scyld ClusterWare provides rich reporting about the availability of the nodes.
You can use either the BeoStatus GUI tool or the bpstat command
to determine the availability of nodes in your cluster. These tools,
which can also be used to monitor node status, are described in the next
section.
If fewer nodes are up than you think should be, or some nodes report an error, check with your Cluster Administrator.
Monitoring Node Status
You can monitor the status of nodes in your cluster with the
BeoStatus GUI tool or with either of two command line tools,
bpstat and beostat. These tools are described in the sections
that follow. Also see the Reference Guide for information on the various
options and flags supported for these tools.
The BeoStatus GUI Tool
The BeoStatus graphical user interface (GUI) tool is the best way to
check the status of the cluster, including which nodes are available or
up. There are two ways to open the BeoStatus GUI as a Gnome X
window, as follows.
Click the BeoStatus icon in the tool tray or in the applications
pulldown.
![]()
Alternatively, type the command beostatus in a terminal window on
the master node; you do not need to be a privileged user to use this
command.
The default BeoStatus GUI mode is a tabular format known as the
"Classic" display (shown in the following figure). You can select
different display options from the Mode menu.
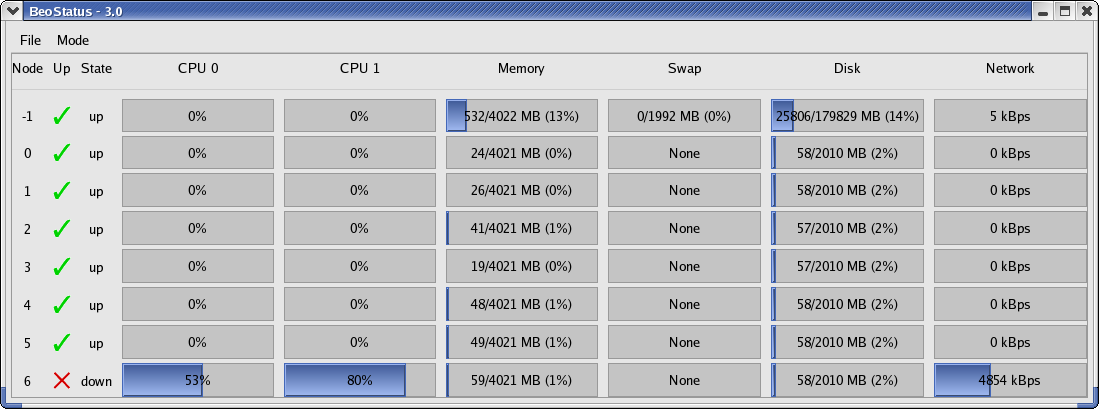
Figure 1. BeoStatus in the "Classic" Display Mode
BeoStatus Node Information
Each row in the BeoStatus display reports information for a single
node, including the following:
- Node — The node's assigned node number, starting at zero. Node -1,
if shown, is the master node. The total number of node entries shown
is set by the "iprange" or "nodes" keywords in the file
/etc/beowulf/config, rather than the number of detected nodes. The entry for an inactive node displays the last reported data in a grayed-out row. - Up — A graphical representation of the node's status. A green checkmark is shown if the node is up and available. Otherwise, a red "X" is shown.
- State — The node's last known state. This should agree with the
state reported by both the
bpstatcommand and in theBeoSetupwindow. - CPU "X" — The CPU loads for the node's processors; at minimum, this indicates the CPU load for the first processor in each node. Since it is possible to mix uni-processor and multi-processor machines in a Scyld cluster, the number of CPU load columns is equal to the maximum number of processors for any node in your cluster. The label "N/A" will be shown for nodes with less than the maximum number of processors.
- Memory — The node's current memory usage.
- Swap — The node's current swap space (virtual memory) usage.
- Disk — The node's hard disk usage. If a RAM disk is used, the maximum value shown is one-half the amount of physical memory. As the RAM disk competes with the kernel and application processes for memory, not all the RAM may be available.
- Network — The node's network bandwidth usage. The total amount of bandwidth available is the sum of all network interfaces for that node.
BeoStatus Update Intervals
Once running, BeoStatus is non-interactive; the user simply monitors
the reported information. The display is updated at 4-second intervals
by default. You can modify this default using the command
beostatus -u secs (where secs is the number of seconds) in a terminal
window or an ssh session to the master node with X-forwarding
enabled.
Tip
Each update places load on the master and compute nodes, as well as the interconnection network. Too-frequent updates can degrade the overall system performance.
BeoStatus in Text Mode
In environments where use of the Gnome X window system is undesirable or
impractical, such as when accessing the master node through a slow
remote network connection, you can view the status of the cluster as
curses text output (shown in the following figure). Do do this, enter
the command beostatus -c in a terminal window on the master node or
an ssh session to the master node.
BeoStatus in text mode reports the same node information as reported
by the "Classic" display, except for the graphical indicator of node
up (green checkmark) or node down (red X). The data in the text
display is updated at 4-second intervals by default.
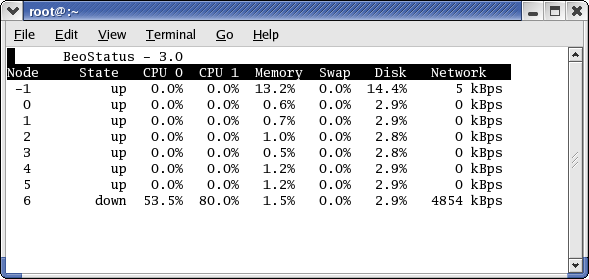
Figure 2. BeoStatus in Text Mode
The bpstat Command Line Tool
You can also check node status with the bpstat command. When run at
a shell prompt on the master node without options, bpstat prints out
a listing of all nodes in the cluster and their current status. You do
not need to be a privileged user to use this command.
Following is an example of the outputs from bpstat for a cluster
with 10 compute nodes.
[user@cluster user] $ bpstat
  Node(s)     Status       Mode       User       Group
    5-9         down         ---------- root       root
    4           up           ---x--x--x any        any
    0-3         up           ---x--x--x root       root
bpstat will show one of the following indicators in the "Status"
column:
- A node marked up is available to run jobs. This status is the
equivalent of the green checkmark in the
BeoStatusGUI. - Nodes that have not yet been configured are marked as down. This
status is the equivalent of the red X in the
BeoStatusGUI. - Nodes currently booting are temporarily shown with a status of boot. Wait 10-15 seconds and try again.
- The "error" status indicates a node initialization problem. Check with your Cluster Administrator.
For additional information on bpstat, see the section on monitoring
and controlling processes later in this chapter. Also see the Reference Guide
for details on using bpstat and its command line options.
The beostat Command Line Tool
You can use the beostat command to display raw status data for
cluster nodes. When run at a shell prompt on the master node without
options, beostat prints out a listing of stats for all nodes in the
cluster, including the master node. You do not need to be a privileged
user to use this command.
The following example shows the beostat output for the master node
and one compute node:
[user@cluster user] $ beostat
model           : 5
model name      : AMD Opteron(tm) Processor 248
stepping        : 10
cpu MHz         : 2211.352
cache size      : 1024 KB
fdiv_bug        : no
hlt_bug         : no
sep_bug         : no
f00f_bug        : no
coma_bug        : no
fpu             : yes
fpu_exception   : yes
cpuid level     : 1
wp              : yes
bogomips        : 4422.05

 *** /proc/meminfo *** Sun Sep 17 10:46:33 2006
        total:    used:    free:  shared: buffers:  cached:
Mem:  4217454592 318734336 3898720256        0 60628992        0
Swap: 2089209856        0 2089209856
MemTotal:   4118608 kB
MemFree:    3807344 kB
MemShared:        0 kB
Buffers:      59208 kB
Cached:           0 kB
SwapTotal:  2040244 kB
SwapFree:   2040244 kB

 *** /proc/loadavg *** Sun Sep 17 10:46:33 2006
3.00 2.28 1.09 178/178 0

 *** /proc/net/dev *** Sun Sep 17 10:46:33 2006
Inter-|   Receive                                                |  Transmit
 face |bytes    packets errs drop fifo frame compressed multicast|bytes    packets errs drop fifo colls carrier compressed
  eth0:85209660   615362        0        0        0     0          0         0 703311290  559376        0        0        0     0       0          0
  eth1:4576500575 13507271        0        0        0     0          0         0 9430333982 13220730        0        0        0     0       0          0
  sit0:       0        0        0        0        0     0          0         0       0       0        0        0        0     0       0          0

 *** /proc/stat ***
cpu0 15040 0 466102 25629625            Sun Sep 17 10:46:33 2006
cpu1 17404 0 1328475 24751544           Sun Sep 17 10:46:33 2006

 *** statfs ("/") *** Sun Sep 17 10:46:33 2006
path:           /
f_type:         0xef53
f_bsize:        4096
f_blocks:       48500104
f_bfree:        41439879
f_bavail:       38976212
f_files:        24641536
f_ffree:        24191647
f_fsid:         000000 000000
f_namelen:      255


============== Node: .0 (index 0) ==================

 *** /proc/cpuinfo *** Sun Sep 17 10:46:34 2006
num processors  : 2
vendor_id       : AuthenticAMD
cpu family      : 15
model           : 5
model name      : AMD Opteron(tm) Processor 248
stepping        : 10
cpu MHz         : 2211.386
cache size      : 1024 KB
fdiv_bug        : no
hlt_bug         : no
sep_bug         : no
f00f_bug        : no
coma_bug        : no
fpu             : yes
fpu_exception   : yes
cpuid level     : 1
wp              : yes
bogomips        : 4422.04

 *** /proc/meminfo *** Sun Sep 17 10:46:34 2006
        total:    used:    free:  shared: buffers:  cached:
Mem:  4216762368 99139584 4117622784        0        0        0
Swap:        0        0        0
MemTotal:   4117932 kB
MemFree:    4021116 kB
MemShared:        0 kB
Buffers:          0 kB
Cached:           0 kB
SwapTotal:        0 kB
SwapFree:         0 kB

 *** /proc/loadavg *** Sun Sep 17 10:46:34 2006
0.99 0.75 0.54 36/36 0

 *** /proc/net/dev *** Sun Sep 17 10:46:34 2006
Inter-|   Receive                                                |  Transmit
 face |bytes    packets errs drop fifo frame compressed multicast|bytes    packets errs drop fifo colls carrier compressed
  eth0:312353878   430256        0        0        0     0          0         0 246128779  541105        0        0        0     0       0          0
  eth1:       0        0        0        0        0     0          0         0       0       0        0        0        0     0       0          0

 *** /proc/stat ***
cpu0 29984 0 1629 15340009              Sun Sep 17 10:46:34 2006
cpu1 189495 0 11131 15170565            Sun Sep 17 10:46:34 2006

 *** statfs ("/") *** Sun Sep 17 10:46:34 2006
path:           /
f_type:         0x1021994
f_bsize:        4096
f_blocks:       514741
f_bfree:        492803
f_bavail:       492803
f_files:        514741
f_ffree:        514588
f_fsid:         000000 000000
f_namelen:      255
The Reference Guide provides details for using beostat and its command line
options.
Issuing Commands
Commands on the Master Node
When you log into the cluster, you are actually logging into the master node, and the commands you enter on the command line will execute on the master node. The only exception is when you use special commands for interacting with the compute nodes, as described in the next section.
Commands on the Compute Node
Scyld ClusterWare provides the bpsh command for running jobs on the compute nodes.
bpsh is a replacement for the traditional Unix utility rsh, used
to run a job on a remote computer. Like rsh, the bpsh arguments
are the node on which to run the command and the command. bpsh
allows you to run a command on more than one node without having to type
the command once for each node, but it doesn't provide an interactive
shell on the remote node like rsh does.
bpsh is primarily intended for running utilities and maintenance
tasks on a single node or a range of nodes, rather than for running
parallel programs. For information on running parallel programs with Scyld ClusterWare,
see Running Programs.
bpsh provides a convenient yet powerful interface for manipulating
all (or a subset of) the cluster's nodes simultaneously. bpsh
provides you the flexibility to access a compute node individually, but
removes the requirement to access each node individually when a
collective operation is desired. A number of examples and options are
discussed in the sections that follow. For a complete reference to all
the options available for bpsh, see the Reference Guide.
Examples for Using bpsh
Example 1. Checking for a File
You can use bpsh to check for specific files on a compute node. For
example, to check for a file named output in the /tmp directory
of node 3, you would run the following command on the master node:
[user@cluster user] $ bpsh 3 ls /tmp/output
The command output would appear on the master node terminal where you issued the command.
Example 2. Running a Command on a Range of Nodes
You can run the same command on a range of nodes using bpsh. For
example, to check for a file named output in the /tmp directory
of nodes 3 through 5, you would run the following command on the master
node:
[user@cluster user] $ bpsh 3,4,5 ls /tmp/output
Example 3. Running a Command on All Available Nodes
Use the -a flag to indicate to bpsh that you wish to run a
command on all available nodes. For example, to check for a file named
output in the /tmp directory of all nodes currently active in
your cluster, you would run the following command on the master node:
[user@cluster user] $ bpsh -a ls /tmp/output
Note that when using the -a flag, the results are sorted by the
response speed of the compute nodes, and are returned without node
identifiers. Because this command will produce output for every
currently active node, the output may be hard to read if you have a
large cluster. For example, if you ran the above command on a 64-node
cluster in which half of the nodes have the file being requested, the
results returned would be 32 lines of /tmp/output and another 32
lines of ls: /tmp/output: no such file or directory. Without node
identifiers, it is impossible to ascertain the existence of the target
file on a particular node.
See the next section for bpsh options that enable you to format the
results for easier reading.
Formatting bpsh Output
The bpsh command has a number of options for formatting its output
to make it more useful for the user, including the following:
- The
-Loption makesbpshwait for a full line from a compute node before it prints out the line. Without this option, the output from your command could include half a line from node 0 with a line from node 1 tacked onto the end, then followed by the rest of the line from node 0. - The
-poption prefixes each line of output with the node number of the compute node that produced it. This option causes the functionality for-Lto be used, even if not explicitly specified. - The
-soption forces the output of each compute node to be printed in sorted numerical order, rather than by the response speed of the compute nodes. With this option, all the output for node 0 will appear before any of the output for node 1. To add a divider between the output from each node, use the-doption. - Using
-dgenerates a divider between the output from each node. This option causes the functionality for-sto be used, even if not explicitly specified.
For example, if you run the command bpsh -a -d -p ls /tmp/output on
an 8-node cluster, the output would make it clear which nodes do and do
not have the file output in the /tmp directory, for example:
0  ---------------------------------------------------------------------
    /tmp/output
1  ---------------------------------------------------------------------
    1: ls: /tmp/output: No such file or directory
2  ---------------------------------------------------------------------
    2: ls: /tmp/output: No such file or directory
3  ---------------------------------------------------------------------
    3: /tmp/output
4  ---------------------------------------------------------------------
    4: /tmp/output
5  ---------------------------------------------------------------------
    5: /tmp/output
6  ---------------------------------------------------------------------
    6: ls: /tmp/output: No such file or directory
7  ---------------------------------------------------------------------
    7: ls: /tmp/output: No such file or directory
bpsh and Shell Interaction
Special shell features, such as piping and input/output redirection, are available to advanced users. This section provides several examples of shell interaction, using the following conventions:
- The command running will be
cmda. - If it is piped to anything, it will be piped to
cmdb. - If an input file is used, it will be
/tmp/input. - If an output file is used, it will be
/tmp/output. - The node used will always be node 0.
Example 4. Command on Compute Node, Output on Master Node
The easiest case is running a command on a compute node and doing something with its output on the master node, or giving it input from the master. Following are a few examples:
[user@cluster user] $ bpsh 0 cmda | cmdb
[user@cluster user] $ bpsh 0 cmda > /tmp/output
[user@cluster user] $ bpsh 0 cmda < /tmp/input
Example 5. Command on Compute Node, Output on Compute Node
A bit more complex situation is to run the command on the compute node and do something with its input (or output) on that same compute node. There are two ways to accomplish this.
The first solution requires that all the programs you run be on the
compute node. For this to work, you must first copy the cmda and
cmdb executable binaries to the compute node. Then you would use the
following commands:
[user@cluster user] $ bpsh 0 sh -c "cmda | cmdb"
[user@cluster user] $ bpsh 0 sh -c "cmda > /tmp/output"
[user@cluster user] $ bpsh 0 sh -c "cmda < /tmp/input"
The second solution doesn't require any of the programs to be on the compute node. However, it uses a lot of network bandwidth as it takes the output and sends it to the master node, then sends it right back to the compute node. The appropriate commands are as follows:
[user@cluster user] $ cmda | bpsh 0 cmdb
[user@cluster user] $ cmda | bpsh 0 dd of=/tmp/output
[user@cluster user] $ bpsh 0 cat /tmp/input | cmda
Example 6. Command on Master Node, Output on Compute Node
You can also run a command on the master node and do something with its input or output on the compute nodes. The appropriate commands are as follows:
[user@cluster user] $ cmda | bpsh 0 cmdb
[user@cluster user] $ cmda | bpsh 0 dd of=/tmp/output
[user@cluster user] $ bpsh 0 cat /tmp/input | cmda
Copying Data to the Compute Nodes
There are several ways to get data from the master node to the compute
nodes. This section describes using NFS to share data, using the Scyld ClusterWare
command bpcp to copy data, and using programmatic methods for data
transfer.
Sharing Data via NFS
The easiest way to transfer data to the compute nodes is via NFS. All
files in your /home directory are shared by default to all compute
nodes via NFS. Opening an NFS-shared file on a compute node will, in
fact, open the file on the master node; no actual copying takes place.
Copying Data via bpcp
To copy a file, rather than changing the original across the network,
you can use the bpcp command. This works much like the standard Unix
file-copying command cp, in that you pass it a file to copy as one
argument and the destination as the next argument. Like the Unix
scp, the file paths may be qualified by a computer host name.
With bpcp, you can indicate the node number for the source file,
destination file, or both. To do this, prepend the node number with a
colon before the file name, to specify that the file is on that node or
should be copied to that node. For example, to copy the file
/tmp/foo to the same location on node 1, you would use the following
command:
[user@cluster user] $ bpcp /tmp/foo 1:/tmp/foo
Programmatic Data Transfer
The third method for transferring data is to do it programmatically. This is a bit more complex than the methods described in the previous section, and will only be described here only conceptually.
If you are using an MPI job, you can have your Rank 0 process on the master node read in the data, then use MPI's message passing capabilities to send the data over to a compute node.
If you are writing a program that uses BProc functions directly, you
can have the process first read the data while it is on the master node.
When the process is moved over to the compute node, it should still be
able to access the data read in while on the master node.
Data Transfer by Migration
Another programmatic method for file transfer is to read a file into
memory prior to calling BProc to migrate the process to another
node. This technique is especially useful for parameter and
configuration files, or files containing the intermediate state of a
computation. See the Reference Guide for a description of the BProc system
calls.
Monitoring and Controlling Processes
One of the features of Scyld ClusterWare that isn't provided in traditional Beowulf
clusters is the BProc Distributed Process Space. BProc presents a
single unified process
space for the entire cluster, run from the master node, where you can
see and control jobs running on the compute nodes. This process space
allows you to use standard Unix tools, such as top, ps, and
kill. See the Administrator's Guide for more details on BProc.
Scyld ClusterWare also includes a tool called bpstat that can be used to determine
which node is running a process. Using the command option bpstat -p
will list all processes currently running by processID (PID), with the
number of the node running each process. The following output is an
example:
[user@cluster user] $ bpstat -p
  PID     Node
   6301    0
   6302    1
   6303    0
   6304    2
   6305    1
   6313    2
   6314    3
   6321    3
Using the command option bpstat -P (with an uppercase "P" instead of
a lowercase "p") tells bpstat to take the output of the ps and
reformat it, pre-pending a column showing the node number. The following
two examples show the difference in the outputs from ps and from
bpstat -P.
Example output from ps:
[user@cluster user] $ ps xf
 PID  TTY      STAT   TIME COMMAND
 6503 pts/2    S      0:00 bash
 6665 pts/2    R      0:00 ps xf
 6471 pts/3    S      0:00 bash
 6538 pts/3    S      0:00 /bin/sh /usr/bin/linpack
 6553 pts/3    S      0:00  \_ /bin/sh /usr/bin/mpirun -np 5 /tmp/xhpl
 6654 pts/3    R      0:03      \_ /tmp/xhpl -p4pg /tmp/PI6553 -p4wd /tmp
 6655 pts/3    S      0:00          \_ /tmp/xhpl -p4pg /tmp/PI6553 -p4wd /tmp
 6656 pts/3    RW     0:01          \_ [xhpl]
 6658 pts/3    SW     0:00          |   \_ [xhpl]
 6657 pts/3    RW     0:01          \_ [xhpl]
 6660 pts/3    SW     0:00          |   \_ [xhpl]
 6659 pts/3    RW     0:01          \_ [xhpl]
 6662 pts/3    SW     0:00          |   \_ [xhpl]
 6661 pts/3    SW     0:00          \_ [xhpl]
 6663 pts/3    SW     0:00              \_ [xhpl]
Example of the same ps output when run through bpstat -P
instead:
[user@cluster user] $ ps xf | bpstat -P
NODE     PID  TTY      STAT   TIME COMMAND
         6503 pts/2    S      0:00 bash
         6666 pts/2    R      0:00 ps xf
         6667 pts/2    R      0:00 bpstat -P
         6471 pts/3    S      0:00 bash
         6538 pts/3    S      0:00 /bin/sh /usr/bin/linpack
         6553 pts/3    S      0:00  \_ /bin/sh /usr/bin/mpirun -np 5 /tmp/xhpl
         6654 pts/3    R      0:06      \_ /tmp/xhpl -p4pg /tmp/PI6553 -p4wd /tmp
         6655 pts/3    S      0:00          \_ /tmp/xhpl -p4pg /tmp/PI6553 -p4wd /tmp
0        6656 pts/3    RW     0:06          \_ [xhpl]
0        6658 pts/3    SW     0:00          |   \_ [xhpl]
1        6657 pts/3    RW     0:06          \_ [xhpl]
1        6660 pts/3    SW     0:00          |   \_ [xhpl]
2        6659 pts/3    RW     0:06          \_ [xhpl]
2        6662 pts/3    SW     0:00          |   \_ [xhpl]
3        6661 pts/3    SW     0:00          \_ [xhpl]
3        6663 pts/3    SW     0:00              \_ [xhpl]
For additional information on bpstat, see the section on monitoring
node status earlier in this chapter. For information on the bpstat
command line options, see the Reference Guide.